Quick start
Objective
Centreon Business Activity Monitoring (Centreon-BAM) is a feature for modelizing IT services and applications from end users point of view. It reports on the status of a service in real time, tracking any changes, thereby allowing you to measure results against business-oriented service level agreements (SLAs) with internal or external users.
Concept
Centreon BAM aggregates raw sets of values, or indicators, against which to measure business performance. These indicators collected by the Centreon monitoring system can be either a Centreon service, a logical rule between multiple services or any another business-centric monitoring indicator, called a Business Activity (BA).
You can use a BA as an indicator for another BA to create an impact tree and modelize the IT services or applications for analysis.
The evolution of a BA object will determine the quality of service (QoS) that reflects how well the application performs for its users. Based on this QoS rating, you can define the BA’s operating levels and the SLA.
If a BA fails, the malfunction(s) that led to the drop in QoS can be analyzed and the SLA failure diagnosed.
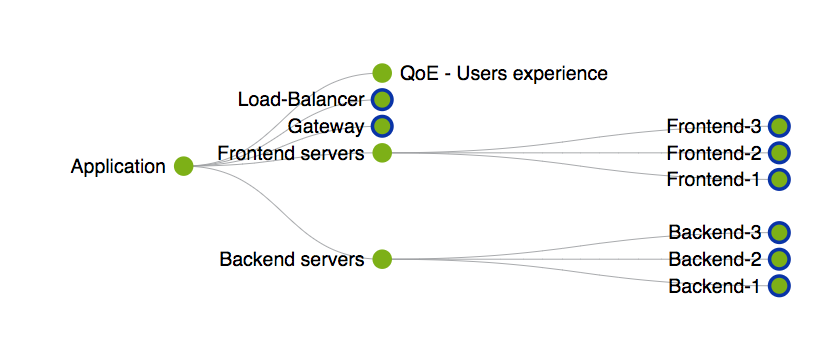
The following is an example of how Centreon BAM modelizes an application:
Initial configuration
Modeling a service or an application (that becomes a BA in Centreon’s world) and its related indicators should be simple and methodical. Ideally, you should first include indicators that are directly related to the overall function of the service/applications and then gradually add other indicators that would have a potential impact on BA status.
All indicators added to a BA must initially be monitored one at a time by the system to determine the operational status of the BA. They can then be incorporated and weighted to reflect the general state of the BA with a blocking, major, minor or null impact on the QoS of a Business Activity.
For instance, if a server ping fails, the impact is weighted as “blocking”, whereas a partition that is 98% full will only have a minor impact, since the service still functions.
This computational logic allows the QoS to reflect the actual status (Availability / Warning or degraded state / Unavailability) much more accurately.
Here is an example of the logic for determining the QoS of an application:
If QoS = 100%, the IT application/service is available.
If QoS > 0% and QoS < 100, the IT application/service is in a Critical or at-risk state.
Si QoS = 0, the IT application/service is unavailable.
The BA thresholds are:
Warning threshold: 99.99%
Critical threshold: 0%.
Actual cases differ and QoS thresholds should be adjusted accordingly. However, we recommend using these thresholds when creating your first BA.
Implementation method
The first step is to create a list of indicators for the BA and then sort them into several categories:
Indicators known to have a blocking impact
Indicators whose impact cannot be measured.
In this case, only be concerned with the Critical indicators states that have a blocking impact. This will make it easier to list and incorporate all the indicators required for the IT service/application to function properly.
Note
We recommend working with the other intermediate or critical states only after you have gained sufficient experience.
Calibrating indicators and calculating the SLA
Using the product on a daily basis helps to follow the daily evolution of the QoS over time and understand the actual maximum threshold below which the application will cease to function.
Whenever an application operates in a Warning state or is unavailable but the BA doesn’t reflect this state, new indicators probably need to be added to the BA definition. Also, existing indicators with low impact should be reviewed in light of the new information available.
When it comes to adjusting the Warning and Critical thresholds of a BA, consider the example of a QoS curve oscillating between 80% and 100%, with an ultimately acceptable level of availability. Some components could cause a drop without really signifying a malfunction. The IT manager could then adjust the BA warning level downwards from 99.99% to 80%. This will unclutter the real-time BA monitoring screens and the Warning alert would then make much more sense.
Nevertheless, it is possible that even without a Critical alert, operation is unsatisfactory. The QoS would indicate the state as being Critical when it falls under 10%, in which case the Critical threshold of the BA should be raised from 0% to 10%.
This computational method refines the availability measurement and makes it more relevant and its QoS value more useful.
Note
It is important not to associate the Warning and Critical thresholds of a BA with the SLA values.
The final value of the SLA is linked to the time spent in OK, Warning / Critical conditions (downtime/uptime), which are visible in the Reporting screens.
Examples:
Warning BA setting: 80%
Critical BA setting: 10%
24/7 monitoring of indicators
Over a 1-day period:
QoS >= Warning = 23hours & 30min (OK)
QoS <= Critical = 10 minutes (Warning)
QoS >= Critical = 20 minutes (Critical)
In this example, the following availability will be calculated:
% Up and optimum performance ~ 98.61% (OK+Warning)
% Up but degraded ~ 97.91% (OK)
% Not available ~ 1.38% (Critical).