Monitoring
Monitoring Windows machines
Introduction
This document describes how you can monitor “private” services and attributes of Windows machines, such as:
Memory usage
CPU load
Disk usage
Service states
Running processes
etc.
Publicly available services that are provided by Windows machines (HTTP, FTP, POP3, etc.) can be monitored easily by following the documentation on monitoring publicly available services.
Note
These instructions assume that you’ve installed Centreon Engine according to the quickstart guide. The sample configuration entries below reference objects that are defined in the sample config files (commands.cfg, templates.cfg, etc.) that are installed if you follow the quickstart.
Overview
Monitoring private services or attributes of a Windows machine requires that you install an agent on it. This agent acts as a proxy between the Centreon Engine plugin that does the monitoring and the actual service or attribute of the Windows machine. Without installing an agent on the Windows box, Centreon Engine would be unable to monitor private services or attributes of the Windows box.
For this example, we will be installing the NSClient++ addon on the Windows machine and using the check_nt plugin to communicate with the NSClient++ addon. The check_nt plugin should already be installed on the Centreon Engine server if you followed the quickstart guide.
Other Windows agents (like NC_Net) could be used instead of NSClient++ if you wish - provided you change command and service definitions, etc. a bit. For the sake of simplicity I will only cover using the NSClient++ addon in these instructions.
Steps
There are several steps you’ll need to follow in order to monitor a new Windows machine. They are: 1. Perform first-time prerequisites 2. Install a monitoring agent on the Windows machine 3. Create new host and service definitions for monitoring the Windows machine 4. Restart the Centreon Engine daemon.
What’s Already Done For You
To make your life a bit easier, a few configuration tasks have already been done for you:
A check_nt command definition has been added to the commands.cfg file. This allows you to use the check_nt plugin to monitor Window services.
A Windows server host template (called windows-server) has already been created in the templates.cfg file. This allows you to add new Windows host definitions in a simple manner.
The above-mentioned config files can be found in the /etc/centreon-engine/objects/
directory. You can modify the definitions in these and other definitions
to suit your needs better if you’d like. However, I’d recommend waiting
until you’re more familiar with configuring Centreon Engine before doing
so. For the time being, just follow the directions outlined below and
you’ll be monitoring your Windows boxes in no time.
Prerequisites
The first time you configure Centreon Engine to monitor a Windows machine, you’ll need to do a bit of extra work. Remember, you only need to do this for the first Windows machine you monitor.
Edit the main Centreon Engine config file:
$ vi /etc/centreon-engine/centengine.cfg
Remove the leading pound (#) sign from the following line in the main configuration file:
#cfg_file=/etc/centreon-engine/objects/windows.cfg
Save the file and exit.
What did you just do? You told Centreon Engine to look to the
/etc/centreon-engine/objects/windows.cfg to find additional object
definitions. That’s where you’ll be adding Windows host and service
definitions. That configuration file already contains some sample host,
hostgroup, and service definitions. For the first Windows machine you
monitor, you can simply modify the sample host and service definitions
in that file, rather than creating new ones.
Installing the Windows Agent
Before you can begin monitoring private services and attributes of Windows machines, you’ll need to install an agent on those machines. I recommend using the NSClient++ addon, which can be found at http://sourceforge.net/projects/nscplus. These instructions will take you through a basic installation of the NSClient++ addon, as well as the configuration of Centreon Engine for monitoring the Windows machine.
Download the latest stable version of the NSClient++ addon from http://sourceforge.net/projects/nscplus
Unzip the NSClient++ files into a new C:NSClient++ directory
Open a command prompt and change to the C:NSClient++ directory
Register the NSClient++ system service with the following command: nsclient++ /install
Install the NSClient++ systray with the following command (‘SysTray’ is case-sensitive): nsclient++ SysTray
Open the services manager and make sure the NSClientpp service is allowed to interact with the desktop (see the ‘Log On’ tab of the services manager). If it isn’t already allowed to interact with the desktop, check the box to allow it to.
Edit the NSC.INI file (located in the C:NSClient++ directory) and make the following changes:
Uncomment all the modules listed in the [modules] section, except for CheckWMI.dll and RemoteConfiguration.dll
Optionally require a password for clients by changing the ‘password’ option in the [Settings] section.
Uncomment the ‘allowed_hosts’ option in the [Settings] section. Add the IP address of the Centreon Engine server to this line, or leave it blank to allow all hosts to connect.
Make sure the ‘port’ option in the [NSClient] section is uncommented and set to ‘12489’ (the default port).
Start the NSClient++ service with the following command: nsclient++ /start
If installed properly, a new icon should appear in your system tray. It will be a yellow circle with a black ‘M’ inside.
Success! The Windows server can now be added to the Centreon Engine monitoring configuration…
Configuring Centreon Engine
Now it’s time to define some object definitions in your Centreon Engine configuration files in order to monitor the new Windows machine.
Open the windows.cfg file for editing:
$ vi /etc/centreon-engine/objects/windows.cfg
Add a new host definition for the Windows machine that you’re going to monitor. If this is the first Windows machine you’re monitoring, you can simply modify the sample host definition in windows.cfg. Change the host_name, alias, and address fields to appropriate values for the Windows box:
define host{
  use       windows-server    ; Inherit default values from a Windows server template (make sure you keep this line!)
  host_name winserver
  alias     My Windows Server
  address   192.168.1.2
}
Good. Now you can add some service definitions (to the same configuration file) in order to tell Centreon Engine to monitor different aspects of the Windows machine. If this is the first Windows machine you’re monitoring, you can simply modify the sample service definitions in windows.cfg.
Note
Replace “winserver” in the example definitions below with the name you specified in the host_name directive of the host definition you just added.
Add the following service definition to monitor the version of the NSClient++ addon that is running on the Windows server. This is useful when it comes time to upgrade your Windows servers to a newer version of the addon, as you’ll be able to tell which Windows machines still need to be upgraded to the latest version of NSClient++:
define service{
  use                 generic-service
  host_name           winserver
  service_description NSClient++ Version
  check_command       check_nt!CLIENTVERSION
}
Add the following service definition to monitor the uptime of the Windows server:
define service{
  use                 generic-service
  host_name           winserver
  service_description Uptime
  check_command       check_nt!UPTIME
}
Add the following service definition to monitor the CPU utilization on the Windows server and generate a CRITICAL alert if the 5-minute CPU load is 90% or more or a WARNING alert if the 5-minute load is 80% or greater:
define service{
  use                 generic-service
  host_name           winserver
  service_description CPU Load
  check_command       check_nt!CPULOAD!-l 5,80,90
}
Add the following service definition to monitor memory usage on the Windows server and generate a CRITICAL alert if memory usage is 90% or more or a WARNING alert if memory usage is 80% or greater:
define service{
  use                 generic-service
  host_name           winserver
  service_description Memory Usage
  check_command       check_nt!MEMUSE!-w 80 -c 90
}
Add the following service definition to monitor usage of the C:\drive
on the Windows server and generate a CRITICAL alert if disk usage is 90%
or more or a WARNING alert if disk usage is 80% or greater:
define service{
  use                 generic-service
  host_name           winserver
  service_description C:\ Drive Space
  check_command       check_nt!USEDDISKSPACE!-l c -w 80 -c 90
}
Add the following service definition to monitor the W3SVC service state on the Windows machine and generate a CRITICAL alert if the service is stopped:
define service{
  use                 generic-service
  host_name           winserver
  service_description W3SVC
  check_command       check_nt!SERVICESTATE!-d SHOWALL -l W3SVC
}
Add the following service definition to monitor the Explorer.exe process on the Windows machine and generate a CRITICAL alert if the process is not running:
define service{
  use                 generic-service
  host_name           winserver
  service_description Explorer
  check_command       check_nt!PROCSTATE!-d SHOWALL -l Explorer.exe
}
That’s it for now. You’ve added some basic services that should be monitored on the Windows box. Save the configuration file.
Password Protection
If you specified a password in the NSClient++ configuration file on the Windows machine, you’ll need to modify the check_nt command definition to include the password. Open the commands.cfg file for editing:
$ vi /etc/centreon-engine/objects/commands.cfg
Change the definition of the check_nt command to include the “-s <PASSWORD>” argument (where PASSWORD is the password you specified on the Windows machine) like this:
define command{
  command_name check_nt
  command_line $USER1$/check_nt -H $HOSTADDRESS$ -p 12489 -s PASSWORD -v $ARG1$ $ARG2$
}
Save the file.
Restarting Centreon Engine
You’re done with modifying the Centreon Engine configuration, so you’ll need to verify your configuration files and restart Centreon Engine.
If the verification process produces any errors messages, fix your configuration file before continuing. Make sure that you don’t (re)start Centreon Engine until the verification process completes without any errors!
Monitoring Linux/Unix machines
Introduction
This document describes how you can monitor “private” services and attributes of Linux/UNIX servers, such as:
CPU load
Memory usage
Disk usage
Logged in users
Running processes
etc.
Publicly available services that are provided by Linux servers (HTTP, FTP, SSH, SMTP, etc.) can be monitored easily by following the documentation on monitoring publicly available services.
Note
These instructions assume that you’ve installed Centreon Engine according to the quickstart guide. The sample configuration entries below reference objects that are defined in the sample config files (commands.cfg, templates.cfg …) that are installed if you follow the quickstart.
Overview
Note
This document has not been completed. I would recommend you read the documentation on the NRPE addon for instructions on how to monitor a remote Linux/Unix server.
There are several different ways to monitor attributes or remote Linux/Unix servers. One is by using shared SSH keys and the check_by_ssh plugin to execute plugins on remote servers. This method will not be covered here, but can result in high load on your monitoring server if you are monitoring hundreds or thousands of services. The overhead of setting up/destroying SSH connections is the cause of this.
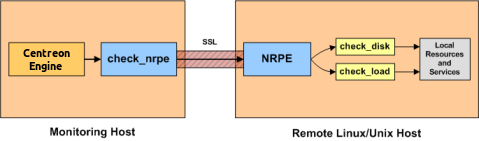
Another common method of monitoring remote Linux/Unix hosts is to use the NRPE addon. NRPE allows you to execute plugins on remote Linux/Unix hosts. This is useful if you need to monitor local resources/attributes like disk usage, CPU load, memory usage, etc. on a remote host.
Monitoring routers/switches
Introduction
This document describes how you can monitor the status of network switches and routers. Some cheaper “unmanaged” switches and hubs don’t have IP addresses and are essentially invisible on your network, so there’s not any way to monitor them. More expensive switches and routers have addresses assigned to them and can be monitored by pinging them or using SNMP to query status information.
I’ll describe how you can monitor the following things on managed switches, hubs, and routers:
Packet loss, round trip average
SNMP status information
Bandwidth / traffic rate
Note
These instructions assume that you’ve installed Centreon Engine according to the quickstart guide. The sample configuration entries below reference objects that are defined in the sample config files (commands.cfg, templates.cfg …) that are installed when you follow the quickstart.
Overview
Monitoring switches and routers can either be easy or more involved
depending on what equipment you have and what you want to monitor. As they are critical infrastructure components, you’ll no doubt want to monitor them in at least some basic manner.
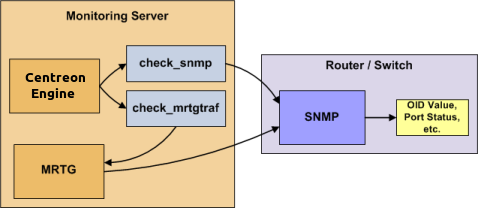
Switches and routers can be monitored easily by “pinging” them to determine packet loss, RTA, etc. If your switch supports SNMP, you can monitor port status, etc. with the check_snmp plugin and bandwidth (if you’re using MRTG) with the check_mrtgtraf plugin.
The check_snmp plugin will only get compiled and installed if you have
the net-snmp and net-snmp-utils packages installed on your system. Make
sure the plugin exists in /libexec before you continue. If it
doesn’t, install net-snmp and net-snmp-utils and recompile/reinstall the
Centreon Engine plugins.
Steps
There are several steps you’ll need to follow in order to monitor a new router or switch. They are:
Perform first-time prerequisites
Create new host and service definitions for monitoring the device
Restart the Centreon Engine daemon
What’s Already Done For You
To make your life a bit easier, a few configuration tasks have already been done for you:
Two command definitions (check_snmp and check_local_mrtgtraf) have been added to the commands.cfg file. These allows you to use the check_snmp and check_mrtgtraf plugins to monitor network routers.
A switch host template (called generic-switch) has already been created in the
templates.cfgfile. This allows you to add new router/switch host definitions in a simple manner.
The above-mentioned config files can be found in the /etc/centreon-engine/objects/
directory. You can modify the definitions in these and other definitions
to suit your needs better if you’d like. However, I’d recommend waiting
until you’re more familiar with configuring Centreon Engine before doing
so. For the time being, just follow the directions outlined below and
you’ll be monitoring your network routers/switches in no time.
Prerequisites
The first time you configure Centreon Engine to monitor a network switch, you’ll need to do a bit of extra work. Remember, you only need to do this for the first switch you monitor.
Edit the main Centreon Engine config file:
$ vi /etc/centreon-engine/centengine.cfg
Remove the leading pound (#) sign from the following line in the main configuration file:
#cfg_file=/etc/centreon-engine/objects/switch.cfg
Save the file and exit.
What did you just do? You told Centreon Engine to look to the
/etc/centreon-engine/objects/switch.cfg to find additional object
definitions. That’s where you’ll be adding host and service definitions
for routers and switches. That configuration file already contains some
sample host, hostgroup, and service definitions. For the first
router/switch you monitor, you can simply modify the sample host and
service definitions in that file, rather than creating new ones.
Configuring Centreon Engine
You’ll need to create some object definitions in order to monitor a new router/switch.
Open the switch.cfg file for editing:
$ vi /etc/centreon-engine/objects/switch.cfg
Add a new host definition for the switch that you’re going to monitor. If this is the first switch you’re monitoring, you can simply modify the sample host definition in switch.cfg. Change the host_name, alias, and address fields to appropriate values for the switch:
 define host{
   use        generic-switch         ; Inherit default values from a template
   host_name  linksys-srw224         ; The name we're giving to this switch
   alias      Linksys SRW224P Switch ; A longer name associated with the switch
   address    192.168.1.253          ; IP address of the switch
   hostgroups allhosts,switches      ; Host groups this switch is associated with
}
Monitoring Services
Now you can add some service definitions (to the same configuration file) to monitor different aspects of the switch. If this is the first switch you’re monitoring, you can simply modify the sample service definition in switch.cfg.
Note
Replace “linksys-srw224p” in the example definitions below with the name you specified in the host_name directive of the host definition you just added.
Monitoring Packet Loss and RTA
Add the following service definition in order to monitor packet loss and round trip average between the Centreon Engine host and the switch every 5 minutes under normal conditions:
define service{
  use                   generic-service                ; Inherit values from a template
  host_name             linksys-srw224p                ; The name of the host the service is associated with
  service_description   PING                           ; The service description
  check_command         check_ping!200.0,20%!600.0,60% ; The command used to monitor the service
  normal_check_interval 5                              ; Check the service every 5 minutes under normal conditions
  retry_check_interval  1                              ; Re-check the service every minute until its final/hard state is determined
}
This service will be:
CRITICAL if the round trip average (RTA) is greater than 600 milliseconds or the packet loss is 60% or more.
WARNING if the RTA is greater than 200 ms or the packet loss is 20% or more.
OK if the RTA is less than 200 ms and the packet loss is less than 20%.
Monitoring SNMP Status Information
If your switch or router supports SNMP, you can monitor a lot of information by using the check_snmp plugin. If it doesn’t, skip this section.
Add the following service definition to monitor the uptime of the switch:
define service{
  use                 generic-service ; Inherit values from a template
  host_name           linksys-srw224p
  service_description Uptime
  check_command       check_snmp!-C public -o sysUpTime.0
}
In the check_command directive of the service definition above, the “-C public” tells the plugin that the SNMP community name to be used is “public” and the “-o sysUpTime.0” indicates which OID should be checked.
If you want to ensure that a specific port/interface on the switch is in an up state, you could add a service definition like this:
define service{
  use                 generic-service ; Inherit values from a template
  host_name           linksys-srw224p
  service_description Port 1 Link Status
  check_command       check_snmp!-C public -o ifOperStatus.1 -r 1 -m RFC1213-MIB
}
In the example above, the “-o ifOperStatus.1” refers to the OID for the operational status of port 1 on the switch. The “-r 1” option tells the check_snmp plugin to return an OK state if “1” is found in the SNMP result (1 indicates an “up” state on the port) and CRITICAL if it isn’t found. The “-m RFC1213-MIB” is optional and tells the check_snmp plugin to only load the “RFC1213-MIB” instead of every single MIB that’s installed on your system, which can help speed things up.
That’s it for the SNMP monitoring example. There are a million things that can be monitored via SNMP, so its up to you to decide what you need and want to monitor. Good luck!
Note
You can usually find the OIDs that can be monitored on a switch by running the following command (replace 192.168.1.253 with the IP address of the switch):
$ snmpwalk -v1 -c public 192.168.1.253 -m ALL .1
Monitoring Bandwidth / Traffic Rate
If you’re monitoring bandwidth usage on your switches or routers using MRTG, you can have Centreon Engine alert you when traffic rates exceed thresholds you specify. The check_mrtgtraf plugin (which is included in the Centreon Engine plugins distribution) allows you to do this.
You’ll need to let the check_mrtgtraf plugin know what log file the MRTG
data is being stored in, along with thresholds, etc. In my example, I’m
monitoring one of the ports on a Linksys switch. The MRTG log file is
stored in /var/lib/mrtg/192.168.1.253_1.log. Here’s the service
definition I use to monitor the bandwidth data that’s stored in the log
file:
define service{
  use                 generic-service ; Inherit values from a template
  host_name           linksys-srw224p
  service_description Port 1 Bandwidth Usage
  check_command       check_local_mrtgtraf!/var/lib/mrtg/192.168.1.253_1.log!AVG!1000000,2000000!5000000,5000000!10
}
In the example above, the /var/lib/mrtg/192.168.1.253_1.log option
that gets passed to the check_local_mrtgtraf command tells the plugin
which MRTG log file to read from. The “AVG” option tells it that it
should use average bandwidth statistics. The “1000000,2000000” options
are the warning thresholds (in bytes) for incoming traffic rates. The
“5000000,5000000” are critical thresholds (in bytes) for outgoing
traffic rates. The “10” option causes the plugin to return a CRITICAL
state if the MRTG log file is older than 10 minutes (it should be
updated every 5 minutes).
Save the file.
Restarting Centreon Engine
Once you’ve added the new host and service definitions to the
switch.cfg file, you’re ready to start monitoring the
router/switch. To do this, you’ll need to
verify your configuration
and restart Centreon Engine.
If the verification process produces any errors messages, fix your configuration file before continuing. Make sure that you don’t (re)start Centreon Engine until the verification process completes without any errors!
Monitoring Network Printers
Introduction
This document describes how you can monitor the status of networked printers. Specifically, HP printers that have internal/external JetDirect cards/devices, or other print servers (like the Troy PocketPro 100S or the Netgear PS101) that support the JetDirect protocol.
The check_hpjd plugin (which is part of the standard Centreon Engine plugins distribution) allows you to monitor the status of JetDirect-capable printers which have SNMP enabled. The plugin is capable of detecting the following printer states:
Paper Jam
Out of Paper
Printer Offline
Intervention Required
Toner Low
Insufficient Memory
Open Door
Output Tray is Full
and more…
Note
These instructions assume that you’ve installed Centreon Engine
according to the quickstart guide. The
sample configuration entries below reference objects that are defined
in the sample config files (commands.cfg, templates.cfg,
etc.) that are installed if you follow the quickstart.
Overview
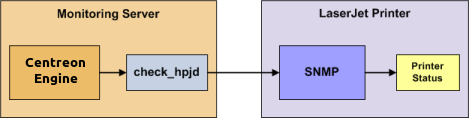
Monitoring the status of a networked printer is pretty simple. JetDirect-enabled printers usually have SNMP enabled, which allows Centreon Engine to monitor their status using the check_hpjd plugin.
The check_hpjd plugin will only get compiled and installed if you have
the net-snmp and net-snmp-utils packages installed on your system. Make
sure the plugin exists in /libexec before you continue. If it
doesn’t, install net-snmp and net-snmp-utils and recompile/reinstall the
Centreon Engine plugins.
Steps
There are several steps you’ll need to follow in order to monitor a new network printer. They are:
Perform first-time prerequisites
Create new host and service definitions for monitoring the printer
Restart the Centreon Engine daemon.
What’s Already Done For You
To make your life a bit easier, a few configuration tasks have already been done for you:
A check_hpjd command definition has been added to the
commands.cfgfile. This allows you to use the check_hpjd plugin to monitor network printers.A printer host template (called generic-printer) has already been created in the templates.cfg file. This allows you to add new printer host definitions in a simple manner.
The above-mentioned config files can be found in the /etc/centreon-engine/objects/
directory. You can modify the definitions in these and other definitions
to suit your needs better if you’d like. However, I’d recommend waiting
until you’re more familiar with configuring Centreon Engine before doing
so. For the time being, just follow the directions outlined below and
you’ll be monitoring your network printers in no time.
Prerequisites
The first time you configure Centreon Engine to monitor a network printer, you’ll need to do a bit of extra work. Remember, you only need to do this for the first printer you monitor.
Edit the main Centreon Engine config file:
$ vi /etc/centreon-engine/centengine.cfg
Remove the leading pound (#) sign from the following line in the main configuration file:
#cfg_file=/etc/centreon-engine/objects/printer.cfg
Save the file and exit.
What did you just do? You told Centreon Engine to look to the
/etc/centreon-engine/objects/printer.cfg to find additional object
definitions. That’s where you’ll be adding host and service definitions
for the printer. That configuration file already contains some sample
host, hostgroup, and service definitions. For the first printer you
monitor, you can simply modify the sample host and service definitions
in that file, rather than creating new ones.
Configuring Centreon Engine
You’ll need to create some object definitions in order to monitor a new printer.
Open the printer.cfg file for editing:
$ vi /etc/centreon-engine/objects/printer.cfg
Add a new host definition for the networked printer that you’re going to monitor. If this is the first printer you’re monitoring, you can simply modify the sample host definition in printer.cfg. Change the host_name, alias, and address fields to appropriate values for the printer:
define host{
  use        generic-printer    ; Inherit default values from a template
  host_name  hplj2605dn         ; The name we're giving to this printer
  alias      HP LaserJet 2605dn ; A longer name associated with the printer
  address    192.168.1.30       ; IP address of the printer
  hostgroups allhosts           ; Host groups this printer is associated with
}
Now you can add some service definitions (to the same configuration
file) to monitor different aspects of the printer. If this is the
first printer you’re monitoring, you can simply modify the sample
service definition in printer.cfg.
Note
Replace “hplj2605dn” in the example definitions below with the name you specified in the host_name directive of the host definition you just added.
Add the following service definition to check the status of the printer. The service uses the check_hpjd plugin to check the status of the printer every 10 minutes by default. The SNMP community string used to query the printer is “public” in this example:
define service{
  use                   generic-service      ; Inherit values from a template
  host_name             hplj2605dn           ; The name of the host the service is associated with
  service_description   Printer Status       ; The service description
  check_command         check_hpjd!-C public ; The command used to monitor the service
  normal_check_interval 10                   ; Check the service every 10 minutes under normal conditions
  retry_check_interval  1                    ; Re-check the service every minute until its final/hard state is determined
}
Add the following service definition to ping the printer every 10 minutes by default. This is useful for monitoring RTA, packet loss, and general network connectivity:
define service{
  use                   generic-service
  host_name             hplj2605dn
  service_description   PING
  check_command         check_ping!3000.0,80%!5000.0,100%
  normal_check_interval 10
  retry_check_interval  1
}
Save the file.
Restarting Centreon Engine
Once you’ve added the new host and service definitions to the
printer.cfg file, you’re ready to start monitoring the printer. To
do this, you’ll need to
verify your configuration and
restart Centreon Engine.
If the verification process produces any errors messages, fix your configuration file before continuing. Make sure that you don’t (re)start Centreon Engine until the verification process completes without any errors!
Monitoring publicly available services (HTTP, FTP, SSH, etc.)
Introduction
This document describes how you can monitor publicly available services, applications and protocols. By “public” I mean services that are accessible across the network - either the local network or the greater Internet. Examples of public services include HTTP, POP3, IMAP, FTP, and SSH. There are many more public services that you probably use on a daily basis. These services and applications, as well as their underlying protocols, can usually be monitored by Centreon Engine without any special access requirements.
Private services, in contrast, cannot be monitored with Centreon Engine without an intermediary agent of some kind. Examples of private services associated with hosts are things like CPU load, memory usage, disk usage, current user count, process information, etc. These private services or attributes of hosts are not usually exposed to external clients. This situation requires that an intermediary monitoring agent be installed on any host that you need to monitor such information on. More information on monitoring private services on different types of hosts can be found in the documentation on:
Note
Occassionally you will find that information on private services and
applications can be monitored with SNMP. The SNMP agent allows you to
remotely monitor otherwise private (and inaccessible) information
about the host. For more information about monitoring services using
SNMP, check out the documentation on
monitoring routers/switches.
These instructions assume that you’ve installed Centreon Engine
according to the quickstart guide. The
sample configuration entries below reference objects that are defined
in the sample commands.cfg and localhost.cfg config files.
Plugins For Monitoring Services
When you find yourself needing to monitor a particular application,
service, or protocol, chances are good that a
plugin exists to monitor it. The official
Centreon Engine plugins distribution comes with plugins that can be used
to monitor a variety of services and protocols. There are also a large
number of contributed plugins that can be found in the contrib/
subdirectory of the plugin distribution. The nagios.org website hosts a
number of additional plugins that have been written by users, so check
it out when you have a chance.
If you don’t happen to find an appropriate plugin for monitoring what you need, you can always write your own. Plugins are easy to write, so don’t let this thought scare you off. Read the documentation on developing plugins for more information.
I’ll walk you through monitoring some basic services that you’ll probably use sooner or later. Each of these services can be monitored using one of the plugins that gets installed as part of the Centreon Engine plugins distribution. Let’s get started…
Creating A Host Definition
Before you can monitor a service, you first need to define a host that is associated with the service. You can place host definitions in any object configuration file specified by a cfg_file directive or placed in a directory specified by a cfg_dir directive. If you have already created a host definition, you can skip this step.
For this example, lets say you want to monitor a variety of services on a remote host. Let’s call that host remotehost. The host definition can be placed in its own file or added to an already exiting object configuration file. Here’s what the host definition for remotehost might look like:
define host{
  use generic-host ; Inherit default values from a template
  host_name remotehost ; The name we're giving to this host
  alias Some Remote Host ; A longer name associated with the host
  address 192.168.1.50 ; IP address of the host
  hostgroups allhosts ; Host groups this host is associated with
}
Now that a definition has been added for the host that will be monitored, we can start defining services that should be monitored. As with host definitions, service definitions can be placed in any object configuration file.
Creating Service Definitions
For each service you want to monitor, you need to define a service in Centreon Engine that is associated with the host definition you just created. You can place service definitions in any object configuration file specified by a cfg_file directive or placed in a directory specified by a cfg_dir directive.
Some example service definitions for monitoring common public service (HTTP, FTP, etc.) are given below.
Monitoring HTTP
Chances are you’re going to want to monitor web servers at some point, either yours or someone else’s. The check_http plugin is designed to do just that. It understands the HTTP protocol and can monitor response time, error codes, strings in the returned HTML, server certificates, and much more.
The commands.cfg file contains a command definition for using the
check_http plugin. It looks like this:
define command{
  name         check_http
  command_name check_http
  command_line $USER1$/check_http -I $HOSTADDRESS$ $ARG1$
}
A simple service definition for monitoring the HTTP service on the remotehost machine might look like this:
define service{
  use                 generic-service ; Inherit default values from a template
  host_name           remotehost
  service_description HTTP
  check_command       check_http
}
This simple service definition will monitor the HTTP service running on remotehost. It will produce alerts if the web server doesn’t respond within 10 seconds or if it returns HTTP errors codes (403, 404, etc.). That’s all you need for basic monitoring. Pretty simple, huh?
Note
For more advanced monitoring, run the check_http plugin manually with –help as a command-line argument to see all the options you can give the plugin. This –help syntax works with all of the plugins I’ll cover in this document.
A more advanced definition for monitoring the HTTP service is shown
below. This service definition will check to see if the
/download/index.php URI contains the string latest-version.tar.gz.
It will produce an error if the string isn’t found, the URI isn’t
valid, or the web server takes longer than 5 seconds to respond:
define service{
  use                 generic-service ; Inherit default values from a template
  host_name           remotehost
  service_description Product Download Link
  check_command       check_http!-u /download/index.php -t 5 -s "latest-version.tar.gz"
}
Monitoring FTP
When you need to monitor FTP servers, you can use the check_ftp plugin.
The commands.cfg file contains a command definition for using the
check_ftp plugin, which looks like this:
define command{
  command_name check_ftp
  command_line $USER1$/check_ftp -H $HOSTADDRESS$ $ARG1$
}
A simple service definition for monitoring the FTP server on remotehost would look like this:
define service{
  use                 generic-service ; Inherit default values from a template
  host_name           remotehost
  service_description FTP
  check_command       check_ftp
}
This service definition will monitor the FTP service and generate alerts if the FTP server doesn’t respond within 10 seconds.
A more advanced service definition is shown below. This service will check the FTP server running on port 1023 on remotehost. It will generate an alert if the server doesn’t respond within 5 seconds or if the server response doesn’t contain the string “Pure-FTPd [TLS]”:
define service{
  use                 generic-service ; Inherit default values from a template
  host_name           remotehost
  service_description Special FTP
  check_command       check_ftp!-p 1023 -t 5 -e "Pure-FTPd [TLS]"
}
Monitoring SSH
When you need to monitor SSH servers, you can use the check_ssh plugin.
The commands.cfg file contains a command definition for using the
check_ssh plugin, which looks like this:
define command{
  command_name check_ssh
  command_line $USER1$/check_ssh $ARG1$ $HOSTADDRESS$
}
A simple service definition for monitoring the SSH server on remotehost would look like this:
define service{
  use                 generic-service ; Inherit default values from a template
  host_name           remotehost
  service_description SSH
  check_command       check_ssh
}
This service definition will monitor the SSH service and generate alerts if the SSH server doesn’t respond within 10 seconds.
A more advanced service definition is shown below. This service will check the SSH server and generate an alert if the server doesn’t respond within 5 seconds or if the server version string string doesn’t match “OpenSSH_4.2”:
define service{
  use                 generic-service ; Inherit default values from a template
  host_name           remotehost
  service_description SSH Version Check
  check_command       check_ssh!-t 5 -r "OpenSSH_4.2"
}
Monitoring SMTP
The check_smtp plugin can be using for monitoring your email servers.
The commands.cfg file contains a command definition for using the
check_smtp plugin, which looks like this:
define command{
  command_name check_smtp
  command_line $USER1$/check_smtp -H $HOSTADDRESS$ $ARG1$
}
A simple service definition for monitoring the SMTP server on remotehost would look like this:
define service{
  use                 generic-service ; Inherit default values from a template
  host_name           remotehost
  service_description SMTP
  check_command       check_smtp
}
This service definition will monitor the SMTP service and generate alerts if the SMTP server doesn’t respond within 10 seconds.
A more advanced service definition is shown below. This service will check the SMTP server and generate an alert if the server doesn’t respond within 5 seconds or if the response from the server doesn’t contain “mygreatmailserver.com”:
define service{
  use                 generic-service ; Inherit default values from a template
  host_name           remotehost
  service_description SMTP Response Check
  check_command       check_smtp!-t 5 -e "mygreatmailserver.com"
}
Monitoring POP3
The check_pop plugin can be using for monitoring the POP3 service on
your email servers. The commands.cfg file contains a command
definition for using the check_pop plugin, which looks like this:
define command{
  command_name check_pop
  command_line $USER1$/check_pop -H $HOSTADDRESS$ $ARG1$
}
A simple service definition for monitoring the POP3 service on remotehost would look like this:
define service{
  use                 generic-service ; Inherit default values from a template
  host_name           remotehost
  service_description POP3
  check_command       check_pop
}
This service definition will monitor the POP3 service and generate alerts if the POP3 server doesn’t respond within 10 seconds.
A more advanced service definition is shown below. This service will check the POP3 service and generate an alert if the server doesn’t respond within 5 seconds or if the response from the server doesn’t contain “mygreatmailserver.com”:
define service{
  use                 generic-service ; Inherit default values from a template
  host_name           remotehost
  service_description POP3 Response Check
  check_command       check_pop!-t 5 -e "mygreatmailserver.com"
}
Monitoring IMAP
The check_imap plugin can be using for monitoring IMAP4 service on your email servers. The commands.cfg file contains a command definition for using the check_imap plugin, which looks like this:
define command{
  command_name check_imap
  command_line $USER1$/check_imap -H $HOSTADDRESS$ $ARG1$
}
A simple service definition for monitoring the IMAP4 service on remotehost would look like this:
define service{
  use                 generic-service ; Inherit default values from a template
  host_name           remotehost
  service_description IMAP
  check_command       check_imap
}
This service definition will monitor the IMAP4 service and generate alerts if the IMAP server doesn’t respond within 10 seconds.
A more advanced service definition is shown below. This service will check the IMAP4 service and generate an alert if the server doesn’t respond within 5 seconds or if the response from the server doesn’t contain “mygreatmailserver.com”:
define service{
  use                 generic-service ; Inherit default values from a template
  host_name           remotehost
  service_description IMAP4 Response Check
  check_command       check_imap!-t 5 -e "mygreatmailserver.com"
}
Restarting Centreon Engine
Once you’ve added the new host and service definitions to your object configuration file(s), you’re ready to start monitoring them. To do this, you’ll need to verify your configuration and restart Centreon Engine.
If the verification process produces any errors messages, fix your configuration file before continuing. Make sure that you don’t (re)start Centreon Engine until the verification process completes without any errors!