Presentation of the main banner
Centreon 18.10 introduces a new main banner. This one is divided in four sections:
State of monitoring platform
Hosts status summary
Services status summary
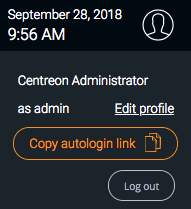
User profil

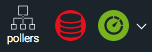
State of monitoring platform
This part summarizes the state of the different servers of the Centreon platform. Two icons displayed:
If all servers are connected to the Centreon Central server.
If the data transfer process has latency.
Note
By clicking on the pollers icon you will be able to view the various issues and directly access the server configuration menu.
Hosts status summary
This part presents a summary of the status of the hosts monitored by the platform.
By clicking on each colored circle representing a status (Down, Unreachable, Up), it is possible to directly access the Monitoring > Status Details > Hosts filtered:

Note
Only statuses not acknowledged or not in downtime are displayed.
If hosts are in Pending state, a colored sticker is present on the hosts icon:

To access to detail, click hosts icon or on the arrow:
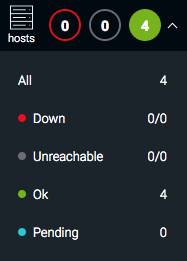
You will be able to visualize the total number of monitored hosts and their distributions by status. By clicking on each status (Down, Unreachable, Up, Pending) you will access directly to the Monitoring > Status Details > Hosts menu filtered.
Services status summary
This part presents a summary of the status of the services monitored by the platform.
By clicking on each colored circle representing a status (Critical, Warning, Unknown, Ok), it is possible to directly access the Monitoring > Status Details > Services filtered:
Note
Only statuses not acknowledged or not in downtime are displayed.
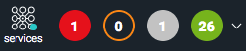
If services are in Pending state, a colored sticker is present on the services icon:

To access to detail, click services icon or on the arrow:
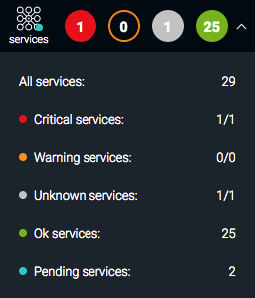
You will be able to visualize the total number of monitored services and their distributions by status. By clicking on each status (Critical, Warning, Unknown, OK, Pending) you will access directly to the Monitoring > Status Details > Services menu filtered.