Monitoring Engine Statistics
The Centreon interface offers the user the possibility of viewing the statistics of all the schedulers and those linked to the broker.
Performance Information
To view the performance information of your scheduler:
Go to the menu Home ==> Monitoring Engine Statistics
In the left menu, click on Performance Info
Choose your scheduler in the drop-down list Poller
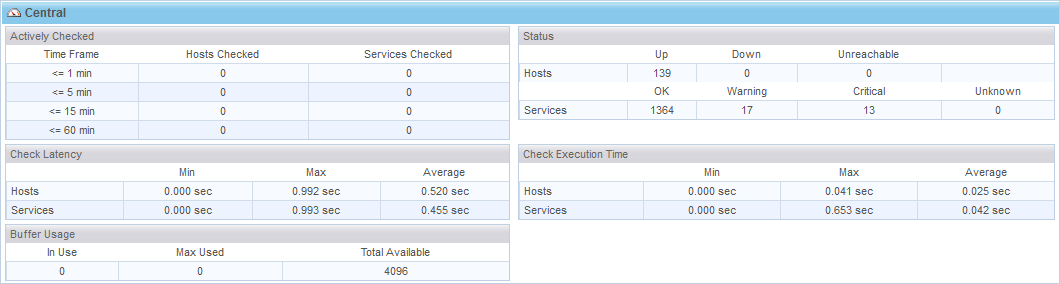
Multiple tables allows to view the performance of your schedulers:
The Actively Checked table can be used to view the number of hosts and services checked in the last minute, the last five minutes, the last quarter of an hour or the last hour.
The Check Latency table can be used to view the minimum, maximum and average latency time of the checks effective on the hosts and the services.
Warning
More than the latency is important and more than the execution of checks by the scheduler will be delayed. This implies a potential high server load.
The Buffer Usage table can be used to view the number of external commands awaiting processing by the scheduler.
Warning
In the case of a passive monitoring injecting many external commands to the scheduler, it is necessary to check this value. If it is too close to the size limit it is possible to lose commands, consequently it is necessary to increase the size of the buffer.
The Status table gives a brief view of the statuses of the hosts and services
The Check Execution Time table can be used to view the execution time of a probe, i.e. the time between when it is started and the moment when it transmits the information to the scheduler.
Warning
The longer the execution time, the more it is detrimental to the execution of the other processes in the queue and the more it generates of the latency. The plugins must be efficient not to engender latency.
Broker Statistics
To view the statistics of Centreon Broker:
Go to the menu Home ==> Monitoring Engine Statistics
In the left menu, click on Broker Statistics
Choose your poller in the list entitled Poller
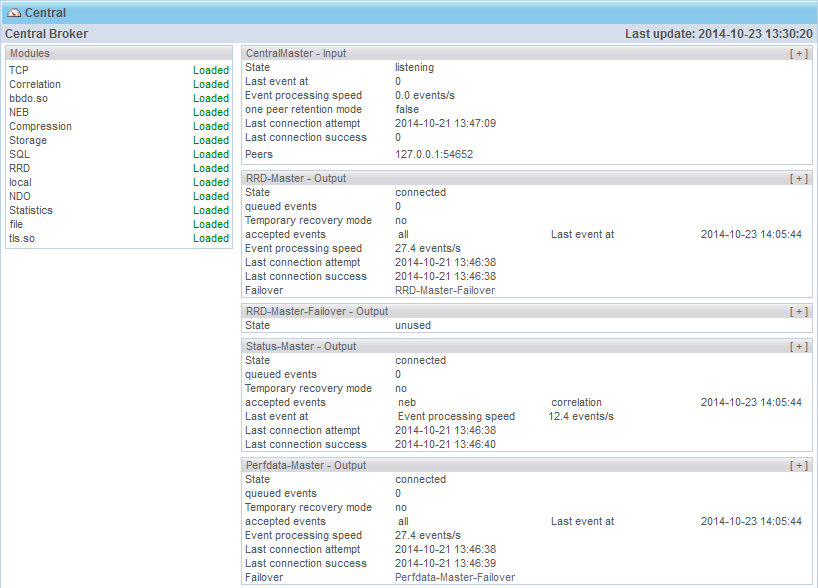
The performance of Centreon Broker is classified by entities of Centreon Broker (module scheduler, Broker-RRD, Broker-Central).
For each entity, the Centreon web interface displays:
The list of loaded Centreon Broker modules
The input/output performance
Input/Output Performance
Each performance contains multiple data:
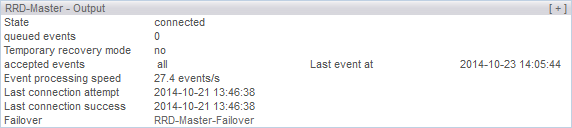
The State field contains the status of the input, of the output and the status of the module itself
The Temporary recovery mode field indicates if the buffer file of the module is in use
The Last event at field indicates the date and the time of the last event to have occurred
The Event processing speed field indicates the number of events processed per second
The Last connection attempt field contains the date and the time of the last connection attempt
The Last connection success field contains the date and the time of the last successful connection
The Peers field describes the entities connected
The One peer retention mode field indicates the enabling or not of the unidirectional connection mode between the Centreon server and the poller
The Queued events field indicates the number of events to be processed
The File being read field indicates the failover file in the progress of being read
The Reading position (offset) field indicates the reading position associated with the failover file
The File being write field indicates the failover file in the progress of being written
The Write position (offset) field indicates the writing position associated with the failover file
The Max file size field indicates the maximum size of the failover file
The Failover field indicates the associated temporary backup file
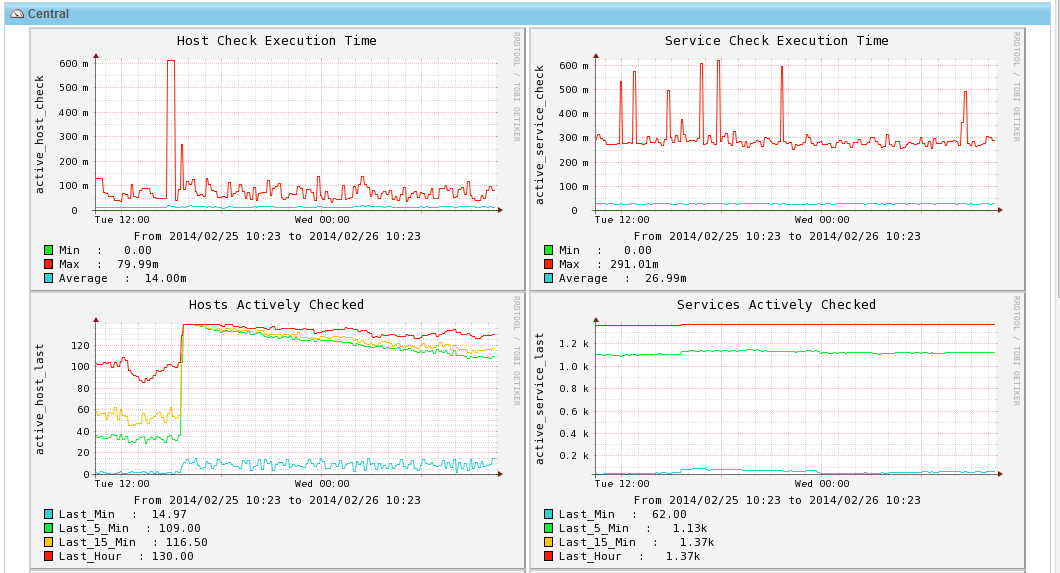
Graphs
It is also possible to view the performance of monitoring engines as performance graphs. For this:
Go to the menu Home ==> Monitoring Engine Statistics
In the left menu, click on Graphs
Choose your poller in the list entitled Poller
Choose the period on which you want to view the performance graphs