Business Activity Monitoring & Reporting
After adding, editing or deleting the BAs, KPIs and BVs the objects linked to Centreon BAM, go to Configuration > Poller, generate the configuration files and push them to the Centreon central server.
After loading the configuration and checked the services linked to the KPIs, the BA will be up to date and available under Monitoring > Business Activity > Monitoring.
Interpreting real-time data
Main page
A table on the main page lists all the essential information concerning live status and health level of the BAs.
Non-admin users can only see the BAs associated with BVs linked to their access group:
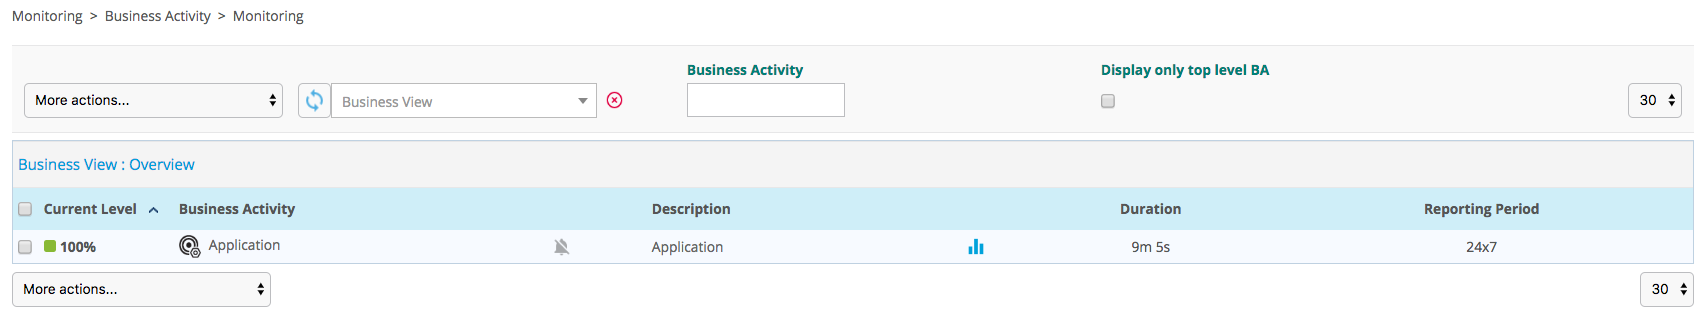
Column |
Description |
Current Level |
Current level in % |
Business Activity |
Name of the BA |
Description |
Description of the BA |
Duration |
Duration of the current status |
Reporting Period |
Default reporting period used for that BA |
You can visualize the evolution of BA health level by hovering your mouse over the name or description of the BA and a pop-up appears displaying all the KPIs and status information.
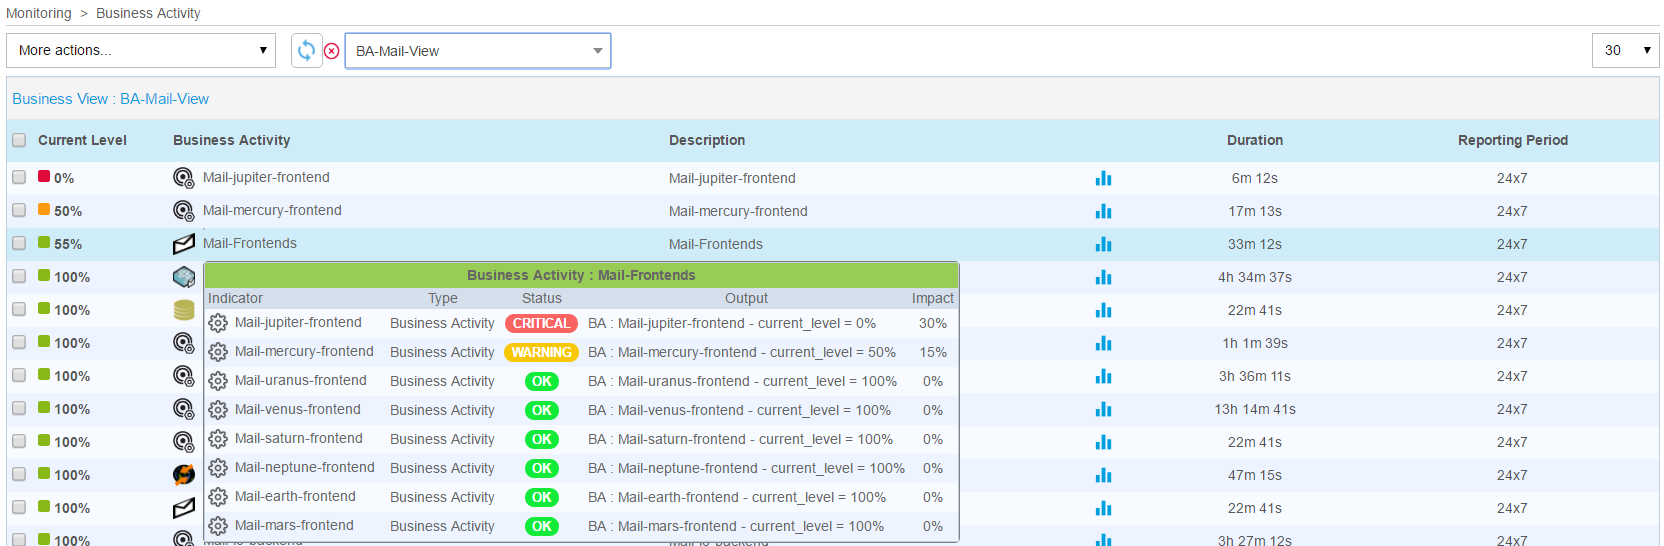
Click on the name of the BA to bring up a detailed live view.
Detailed View
The detailed view is divided into seven parts:
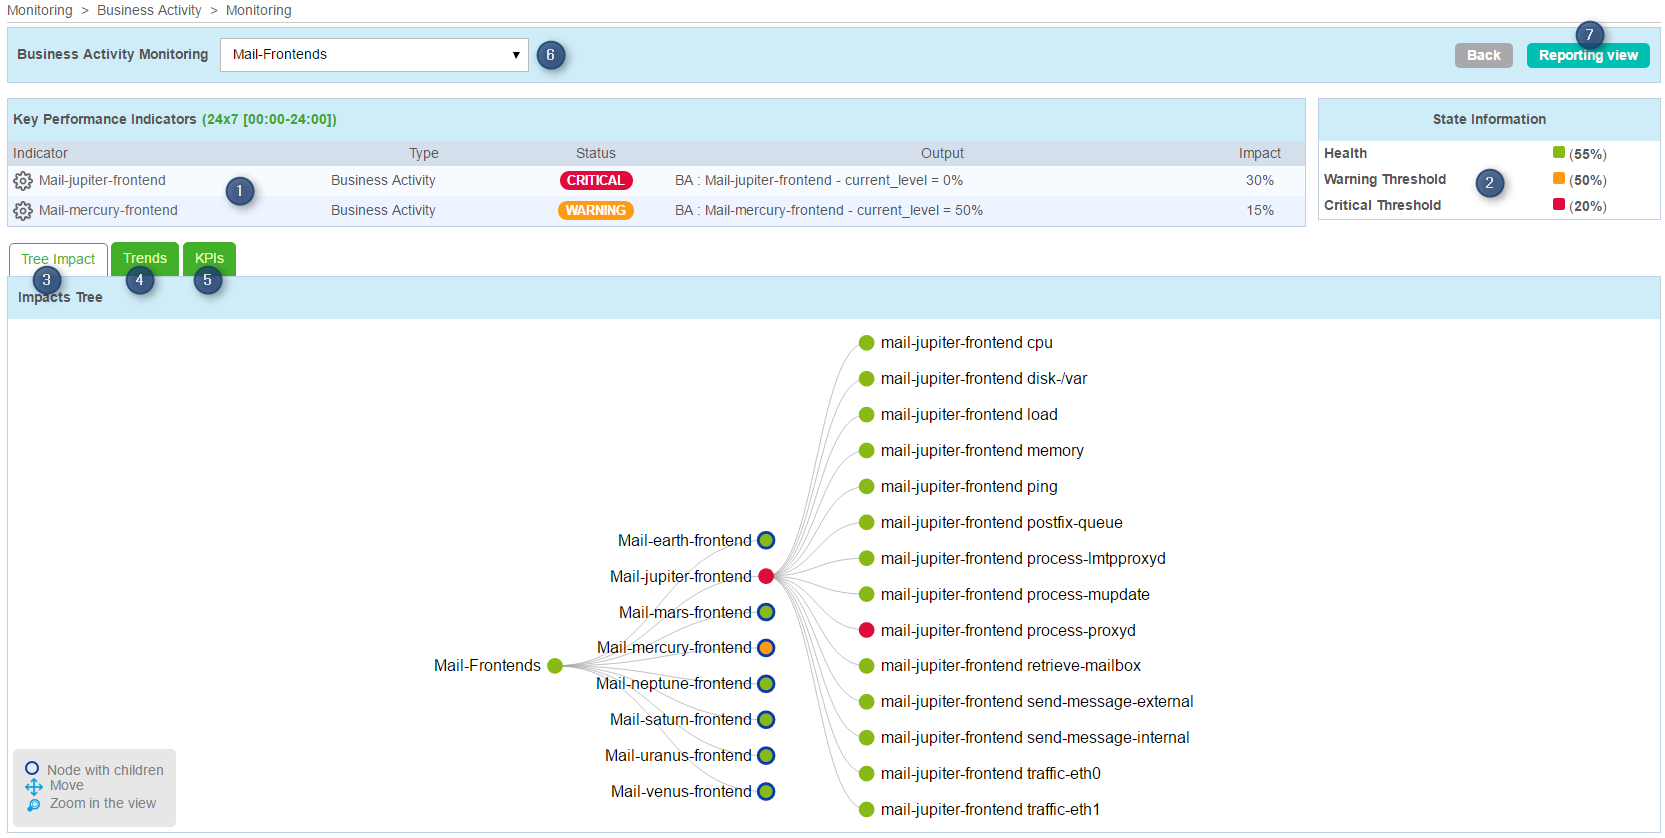
List of KPIs that impact the BA level
Table containing the BA health level and alert thresholds
Tab containing the BA impact tree. You can open a sublevel, zoom in and out and move the tree.
Tab containing the health level graph of the BA
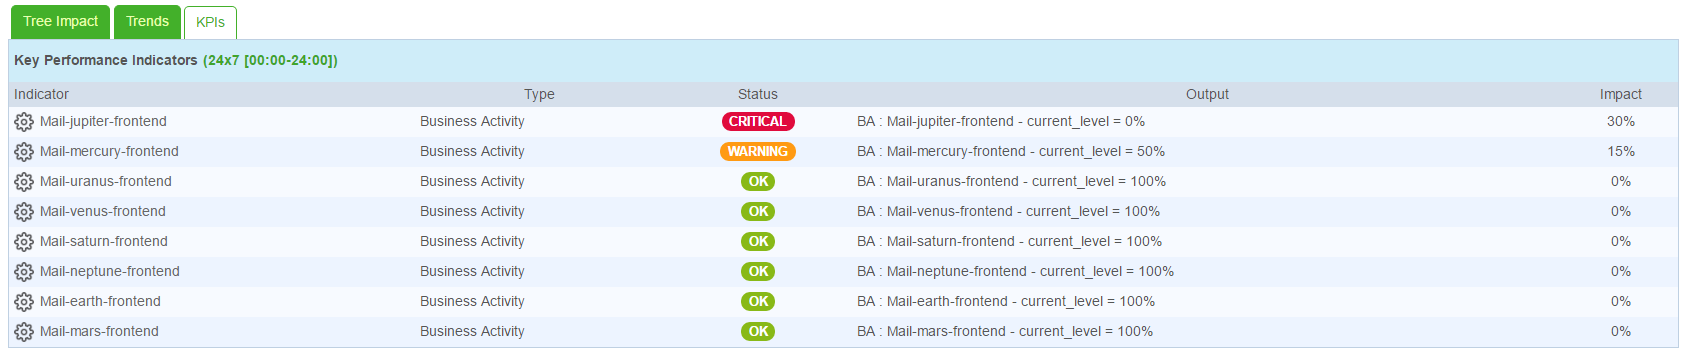
Tab containing a list of all KPIs.
Dropdown list to change the BA
Link to the reporting page.
The list of KPIs display real-time information on their status and also their impact on the BA:
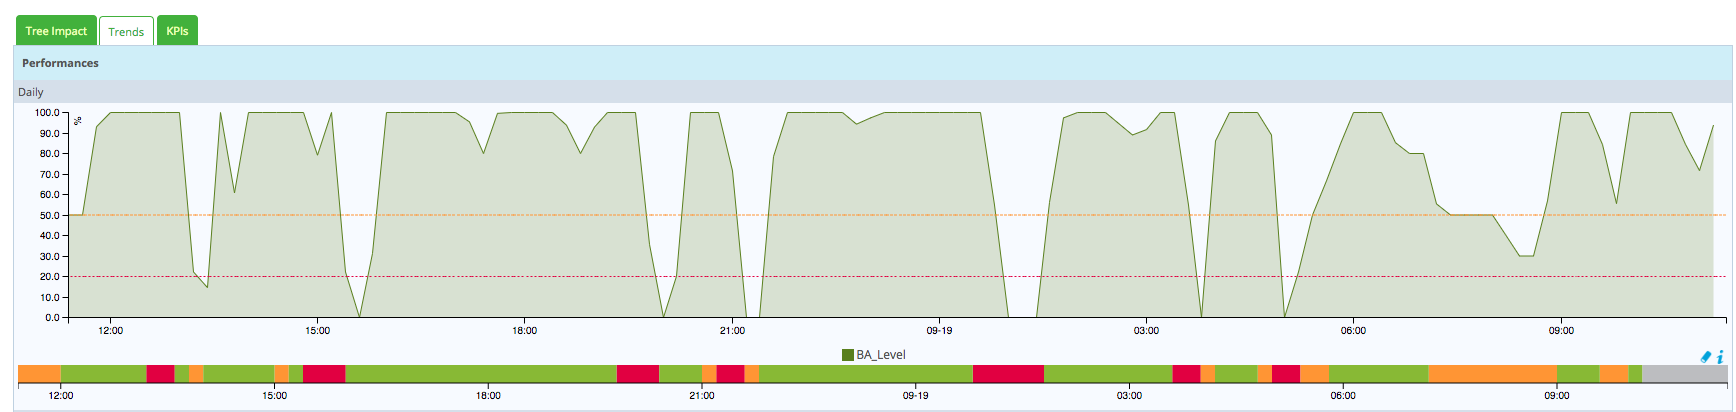
The Trend tab panel displays four graphs – daily, weekly, monthly and annually showing the BA level and status over time:
Interpreting reporting data
You can visualize, at any time, the evolution of archived data on the reporting and log screens, and on performance graphs. These screens are similar to those used on the Centreon server.
Reporting
The reporting page to the “Reporting > Dashboard” one on Centreon. Select a BA to display operational availability, warning and critical statistics for a given period:
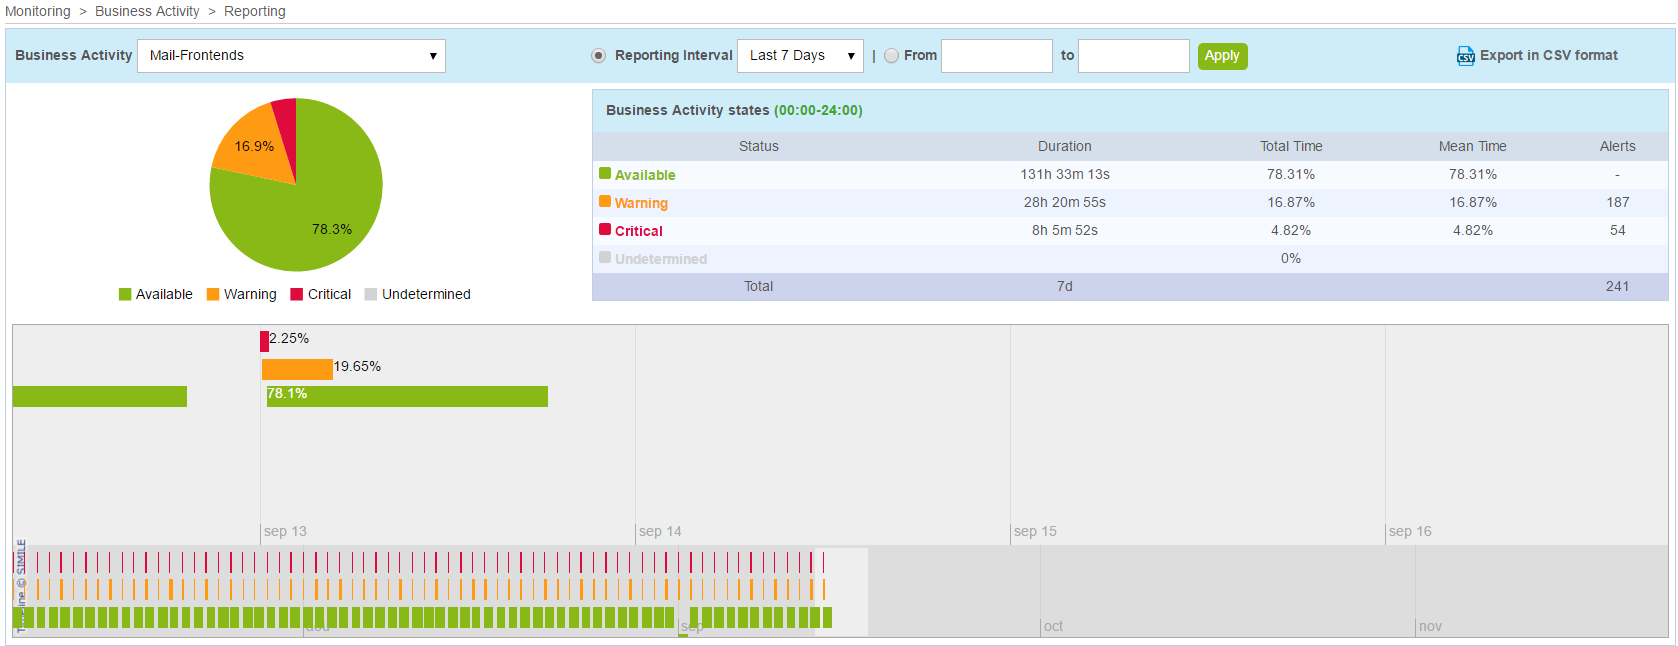
You can export the data to a .csv file by clicking on the Export in CSV format link.
Logs
The Logs menu displays the evolution of the BA level over time along with its KPI status when impacting the BA, for a given period. The maximum historical day is the last 30 days.
Only changes in BA status are recorded: you cannot display the status of KPIs at a specific point in time.
First, select the BA and the time period:

The Display details box shows the BA status on a growth curve.
This chart displays the evolution of the BA health level in a given time frame. Click on each spike to display the KPIs impacting the BA.
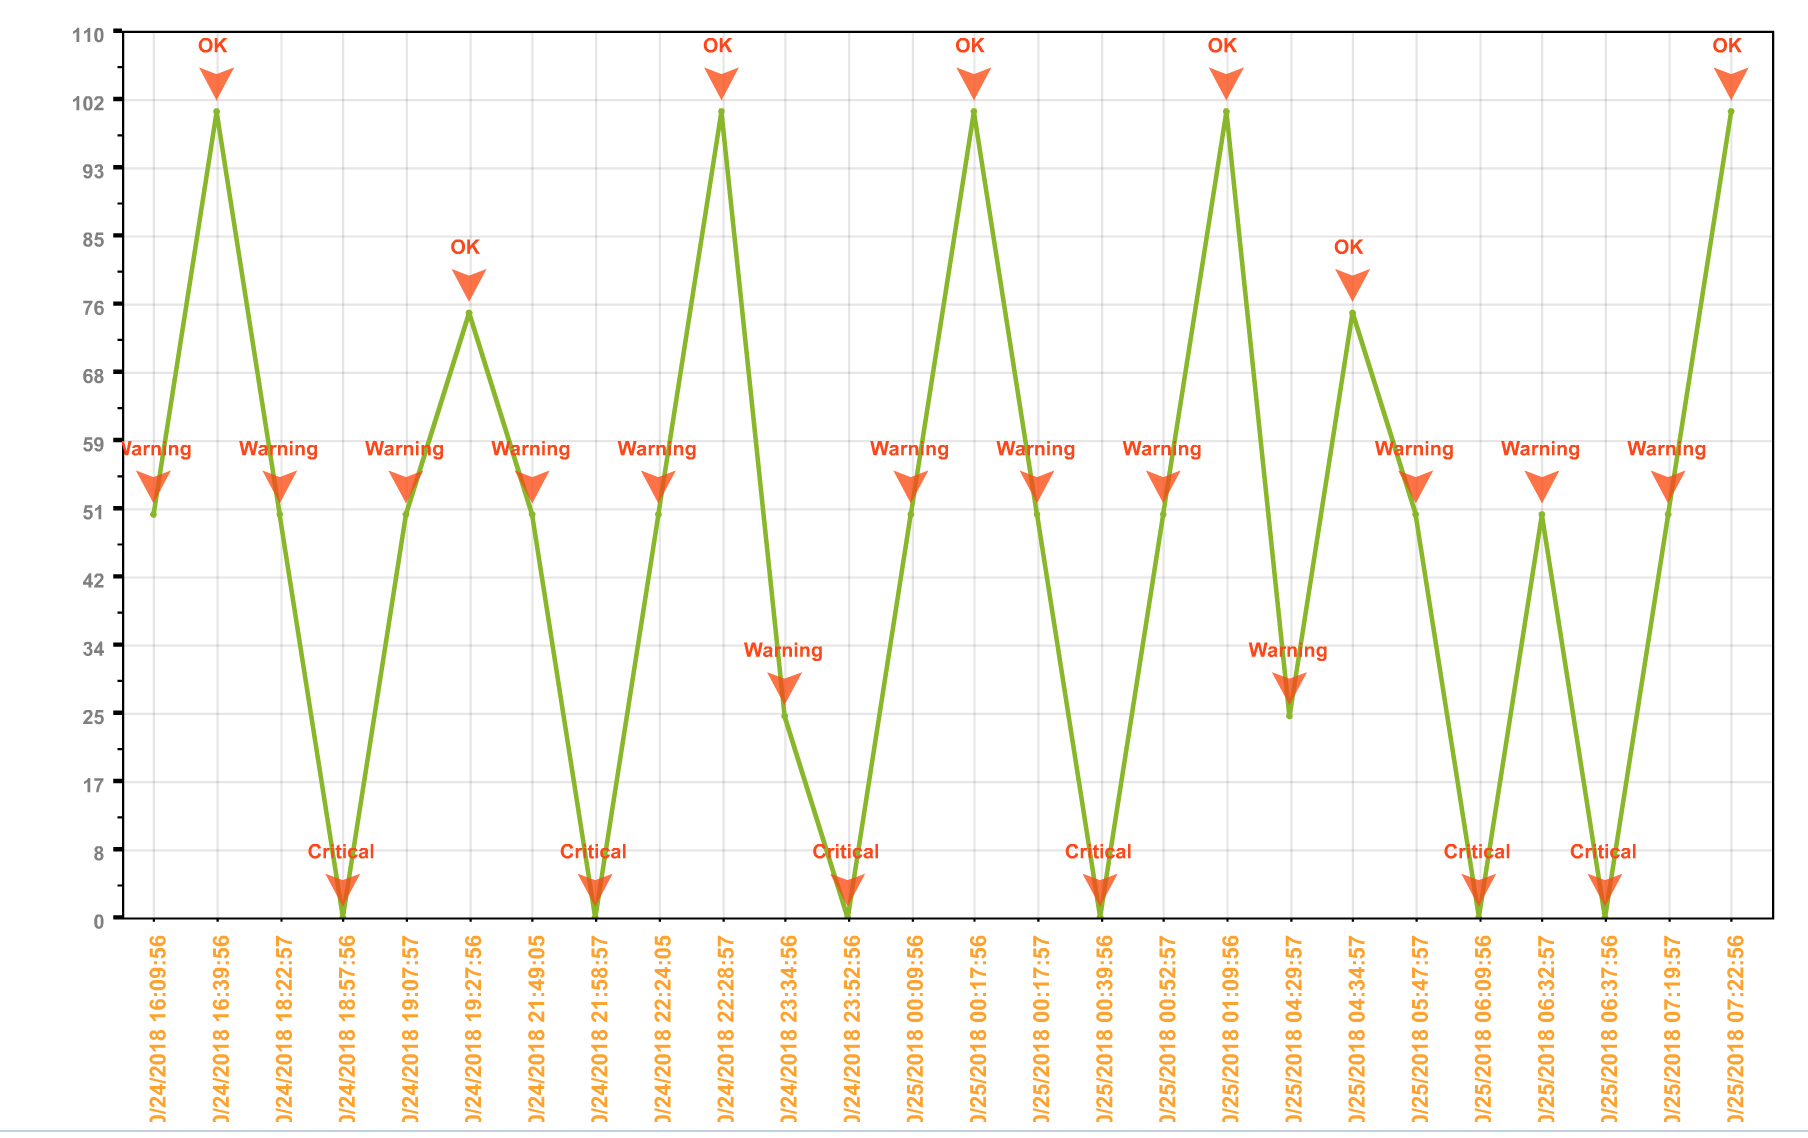
The table below details the KPI screen:
Column |
Description |
Key Performance Indicators |
KPI List |
KPI Type |
KPI type (service, meta service or BA) |
Status |
KPI status (Operational, Warning, Critical, Unknown) |
Impact |
KPI impact weight on the BA |
In Downtime |
Programming or no programming of downtime on the KPI at the time of calculation |
Check Time |
Time during which the KPI was verified |
Output |
KPI output message during the KPI check |