BA Monitoring
Once the BAs, KPIs and BVs have been configured, they have to be transferred to the Monitoring Engine. For this, the configuration has to be generated, go to the following page and push the configuration :
Configuration > Monitoring Engines
Once the Monitoring Engine has been restarted, the statuses of the different BAs will automatically be calculated and displayed on the Business Activity Monitoring page:
Monitoring > Business Activity > Monitoring
Interpretation of real-time data
Main page
The main page consist of a table listing all the important information concerning live status & service level of BAs. It’s possible to filter the BA visible in that page using the BV filter.
A non admin user only sees BAs linked to BVs he has access to.
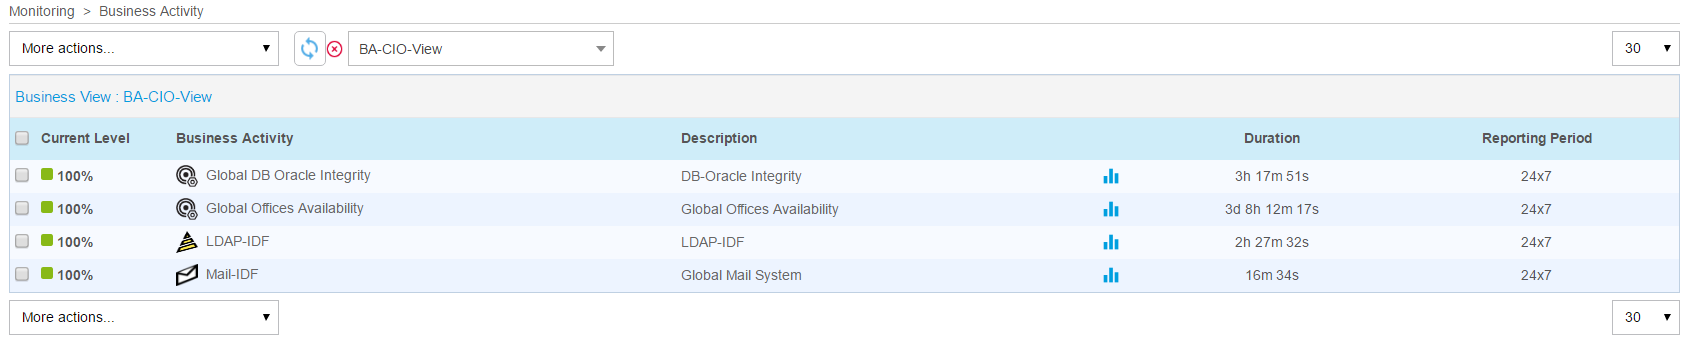
You may mind the following information :
Column |
Description |
Current Level |
Current level in % |
Business Activity |
Name of the BA |
Description |
Description |
Duration |
Duration of the current status |
Reporting Period |
Default reporting period used for that BA |
It’s possible to see the level evolution on a graph by putting the mouse over graph icon. Click on this icon to go to the performance page displaying that graph.
By putting the mouse over the name of the BA, a pop-in appears displaying all the KPIs and status information.

Clicking on the name of the BA brings you to a detail live view.
Detailed View
The detail view can be divided into 7 different parts.
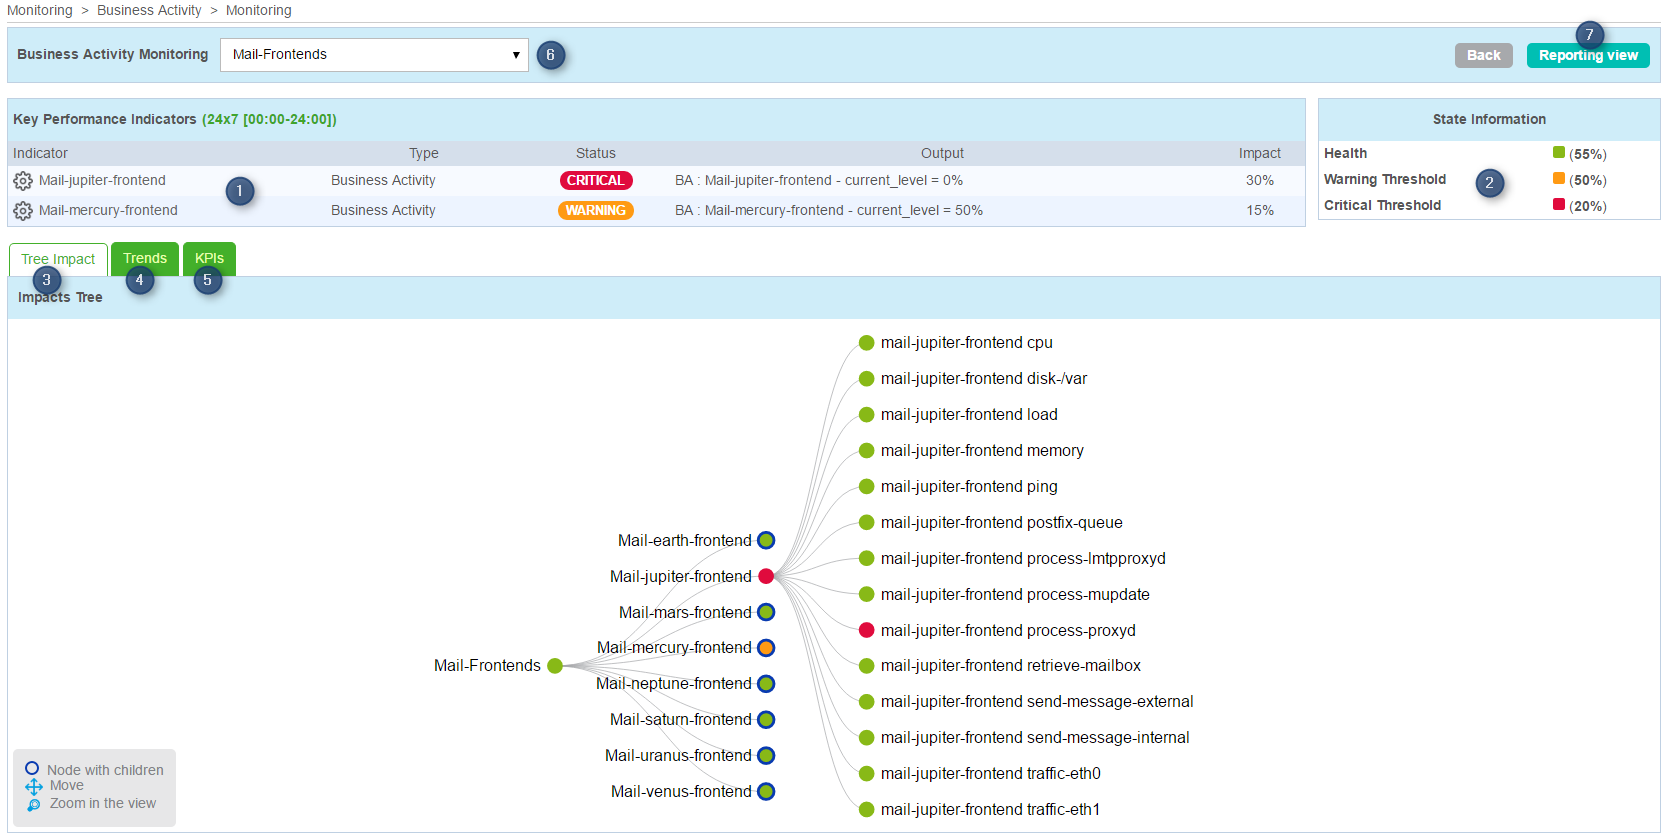
List of KPIs that impact the level of the BA.
Table containing the BA level and alert thresholds.
Tab containing the impact tree. You can open sublevel, zoom in and out and move the tree.
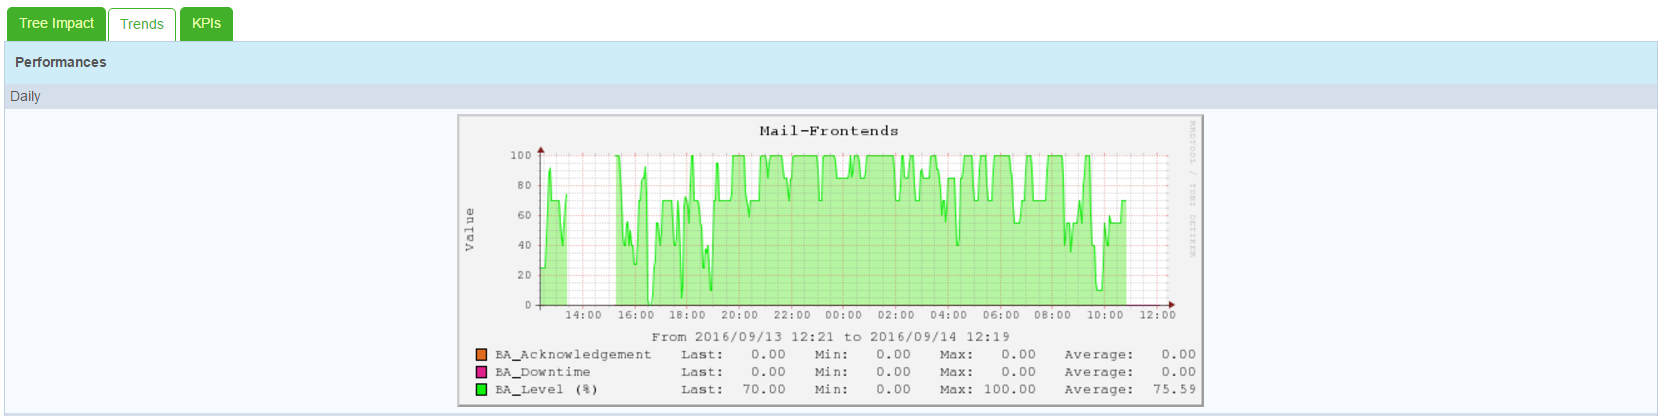
Tab containing the performance level graph of the BA.
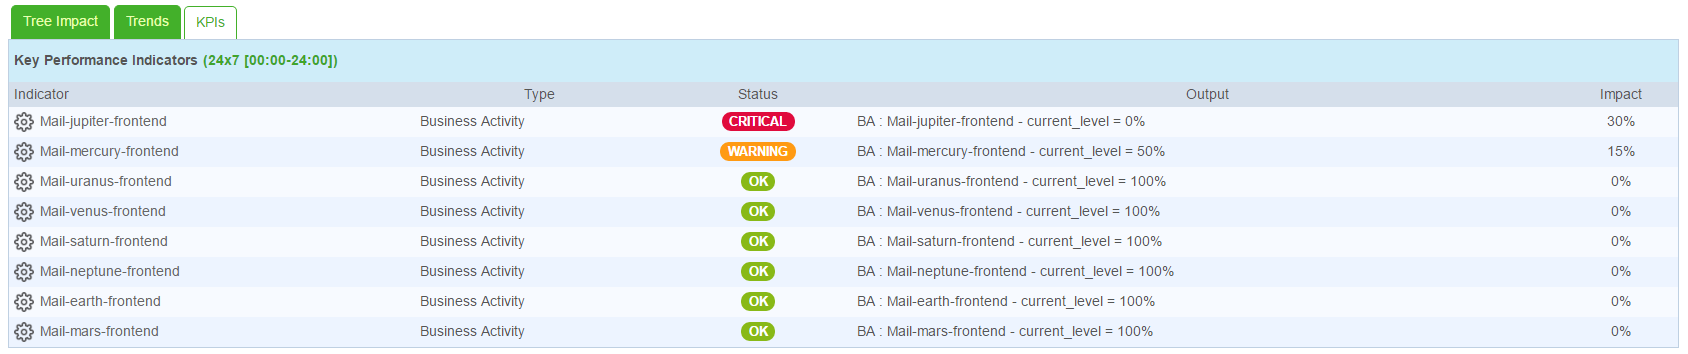
Tab containing a list of all KPIs
Dropdown list to change the BA
Link to the reporting page
The list of KPIs display real time information and current impacts of each KPI :
The performance graph tab display 4 graphs: daily, weekly, monthly and annually :
Interpretation of archive data
The evolution of archived data on the reporting and log pages and on performance graphs can be visualized at any time. These pages are similar to those used in Centreon.
Reporting
The reporting page corresponds to that of Centreon , just select a BA to display its operational availability, warning and critical statistics within a given period.
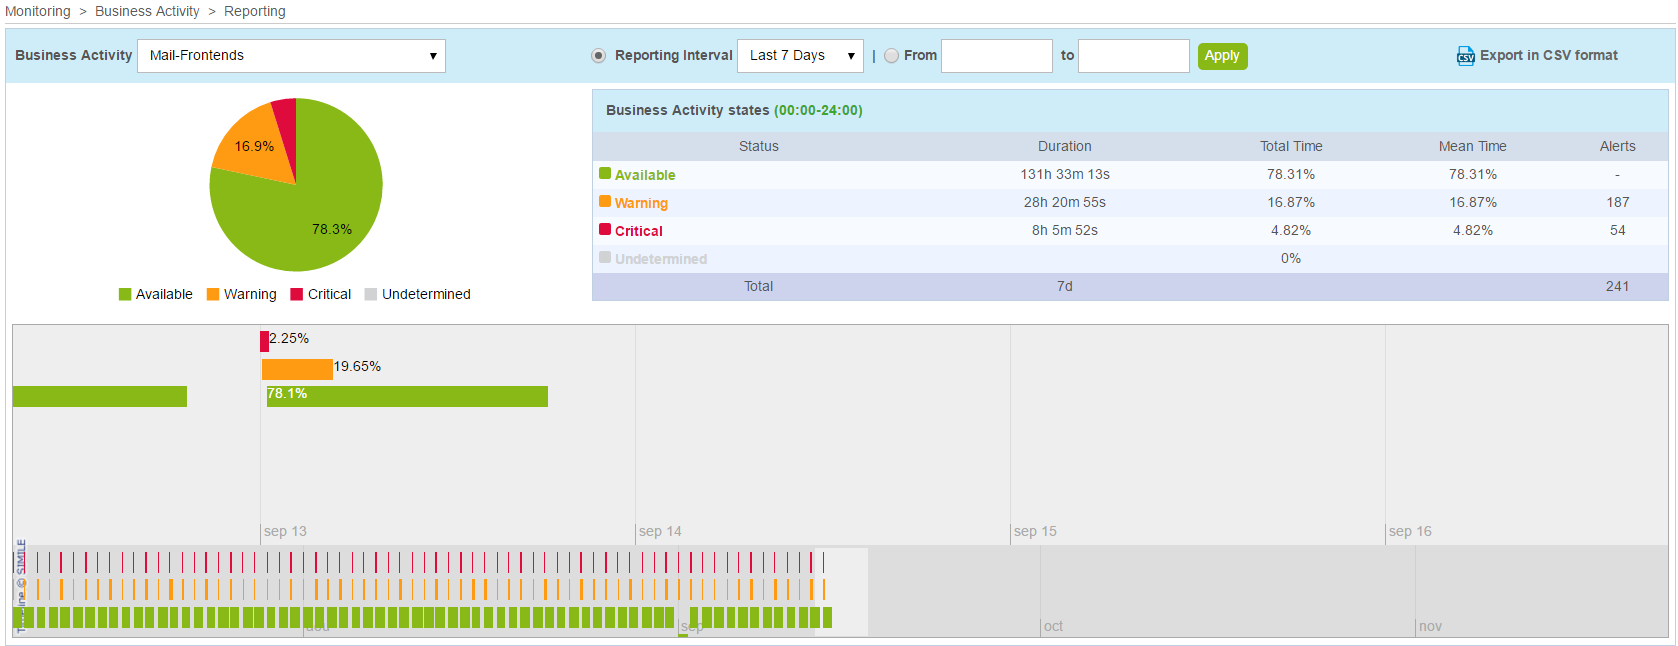
It is possible to export the data to a SSV file, by clicking on the “Export in SSV format” link.
Logs
The “Logs” menu allows the evolution of the BA value in terms of KPI condition changes to be traced over a chosen period.
Only the BA status changes are recorded. That is to say that you cannot visualise the condition of the KPI at an exact time. In order to evaluate the condition of the KPIs, the last known condition must be used as the basis.


Select the time period.
The “display details” box allows the BA statuses to be displayed on the growth curve.

This chart displays the level evolution of the BA in a timeframe.
A scroll bar allows you to navigate through time, it also allows the time scale on the graph to be adjusted. It is sufficient to enlarge or shrink the scroll bar as required. You can also scroll by clicking and holding the mouse over the graph.

By clicking on a curve point of the BA, a new screen appears and shows the detail of the different KPIs, their statuses and their weight impact, which make up the BA at the time where the status change occurred.

Column |
Description |
Key Performance Indicators |
KPI List |
KPI Type |
KPI type (service, meta service or a BA) |
Status |
KPI status (operational, warning, critical, unknown) |
Impact |
KPI impact weight on the BA |
In Downtime |
Programming or no programming of downtime on the KPI at the time of calculation |
Check Time |
Time during which the KPI was verified |
Output |
KPI output message during the KPI check |
Performances
The “performances” part allows you to display performance graphs of one or more BAs. Go to “Monitoring > Business Activity > Performances”

By selecting several BAs using the filter, you can easily compare their respective developments. A menu allows a time period to be modified. Select the type, predefined or manual, then the period and finally click on “Apply” to obtain a measurement period.
« BA_Level » metric : Corresponds to the BA level / service level. This value is calculated regarding KPI status and impacts.
« BA_Downtime » metric : Corresponds to the time when the BA was in planned downtime.
« BA_Acknowledgement » metric : Corresponds to the time when the BA was acknowledged.