Custom views
Presentation
The custom views allow each user to have his own monitoring view. A view may contain 1 to 3 columns. Each column can contain widgets.
A widget is a module allowing certain information to be viewed on certain objects. It is possible to insert multiple widgets of different types in the same view. By default, Centreon offers widgets allowing to obtain information on: hosts, host groups, services, service groups. Finally, the last widget allows to view real time performance graphs.
Views Management
All the manipulations below take place in the page entitled Home > Custom Views. This page is also the first page displayed when a user logs into Centreon.
Add view
To add a view, click on Add view.
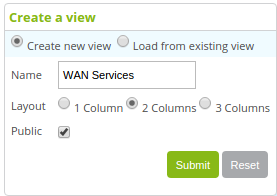
The View name field indicates the name of the view which will be visible by the user
The Layout field allows to choose the number of columns in the view
To change an existing view, click on Edit view.
Note
The reduction in the number of columns removes the widgets associated with the column.
Insert widget
To add a widget, click on Add widget.
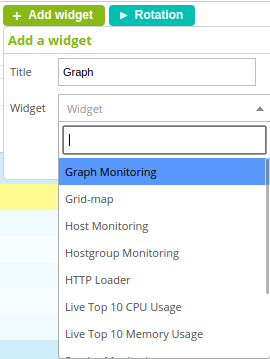
The Widget Title field is used to define a name for our widget
Choose from the table below the widget type you want to add
Customize widget
It is possible to move a widget by drag-and-drop from the title bar.
To reduce a widget, click on  .
By default, the information contained in the widget is refreshed regularly.
To refresh it manually, click on
.
By default, the information contained in the widget is refreshed regularly.
To refresh it manually, click on  .
.
To customize your widget, click on  .
.
Delete widget
It is possible to delete the widget by clicking on  .
.
Widgets Details
The paragraphs below detail the attributes of each widget after clicking on .
Host widget
Filters
The Host Name Search field can be used to make a search on one hostname
If the Display Up box is checked, the hosts with UP status will be displayed
If the Display Down box is checked, the hosts with DOWN status will be displayed
If the Display Unreachable box is checked, the hosts with UNREACHABLE status will be displayed
The Acknowledgement Filter list allows to display the acknowledged or not acknowledged hosts (if the list is empty, the two types of hosts will be displayed)
The Downtime Filter list allows to display the hosts that are subject or not subject to a downtime (if the list is empty, the two types of hosts will be displayed)
The State Type list allows to display the hosts in SOFT or HARD states (if the list is empty, the two types of hosts will be displayed)
The Hostgroup list allows to display the hosts belonging to a certain host group (if the list is empty, all the hosts will be displayed)
The Results list limits the number of results
Columns
If the Display Host Name box is checked, the host name will be displayed
If the Display Output box is checked, the message associated with the status of the host will be displayed
The Output Length list can be used to limit the length of the message displayed
If the Display Status box is checked, the status of the host is displayed
If the Display IP box is checked, the IP address of the host is displayed
If the Display last Check box is checked, the date and the time of the last check is displayed
If the Display Duration box is checked, the time during which the host has retained its status is displayed
If the Display Hard State Duration box is checked, the time during which the host has retained its HARD state is displayed
If the Display Tries box is checked, the number tries before the validation of the status is displayed
The Order By list allows to classify the hosts in alphabetical order according to multiple settings
Misc
The Refresh Interval (seconds) field allows to define the time before data refreshment
Service widget
Filters
The Host Name field can be used to make a search on one hostname
The Service Description field can be used to make a search on service name
If the Display Ok box is checked, the services with OK status will be displayed
If the Display Warning box is checked, the services with WARNING status will be displayed
If the Display Critical box is checked, the services with CRITICAL status will be displayed
If the Display Unknown box is checked, the services with UNKNOWN status will be displayed
If the Display Pending box is checked, the services with PENDING status will be displayed
The Acknowledgment Filter list allows to display the services acknowledged or not acknowledged (if the list is empty, the two types of hosts will be displayed)
The Downtime Filter list allows to display the services that are subject or not subject to a downtime (if the list is empty, the two types of hosts will be displayed)
The State Type list allows to display the services with SOFT or HARD states (if the list is empty, the two types of hosts will be displayed)
The Hostgroup list allows to display the services belonging hosts belonging to a certain host group (if the list is empty, all the services will be displayed)
The Servicegroup list allows to display the services belonging to a certain service group (if the list is empty, all the services will be displayed)
The Results list limits the number of results
Columns
If the Display Host Name box is checked, the host name will be displayed
If the Display Service Description box is checked, the name of the service will be displayed
If the Display Output box is checked, the message associated with the status of the host will be displayed
The Output Length list can be used to limit the length of the message displayed
If the Display Status box is checked, the status of the host is displayed
If the Display last Check box is checked, the date and the time of the last check is displayed
If the Display Duration box is checked, the time during which the host has retained its status is displayed
If the Display Hard State Duration box is checked, the time during which the host has retained its HARD state is displayed
If the Display Tries box is checked, the number of tries before the validation of the status is displayed
The Order By list allows to classify the services in alphabetical order according to multiple settings
Misc
The Refresh Interval (seconds) field allows to define the time before data refreshment
Performance Graph widget
The Service field is used to choose the service for which the graph will be displayed
The Graph period list is used to choose the time period for which the graph will be displayed
The Refresh Interval (seconds) field allows to define the time before data refreshment
Host Group widget
The Hostgroup Name Search field can be used to choose the host groups displayed
If the Enable Detailed Mode box is checked, all the host names and the services associated with these hosts will be displayed for the hostgroups selected
The Results list allows us to limit the number of results
The Order By list is used to classify the service in alphabetical order according to multiple settings
The Refresh Interval (seconds) field allows to define the time before data refreshment
Service Group widget
The Servicegroup Name Search field can be used to choose the service groups displayed
If the Enable Detailed Mode box is checked, all the host names and the services associated with these hosts will be displayed for the service groups selected
The Results list allows us to limit the number of results
The Order By list is used to classify the service in alphabetical order according to multiple settings
The Refresh Interval (seconds) field allows to define the time before data refreshment