Event logs
Definition
Event logs allow us to:
View the changes of status and state of the monitored objects
See the notifications sent and their recipients
These logs can be viewed over a given time.
Viewing
To view the event logs, go into the menu: Monitoring > Event logs.
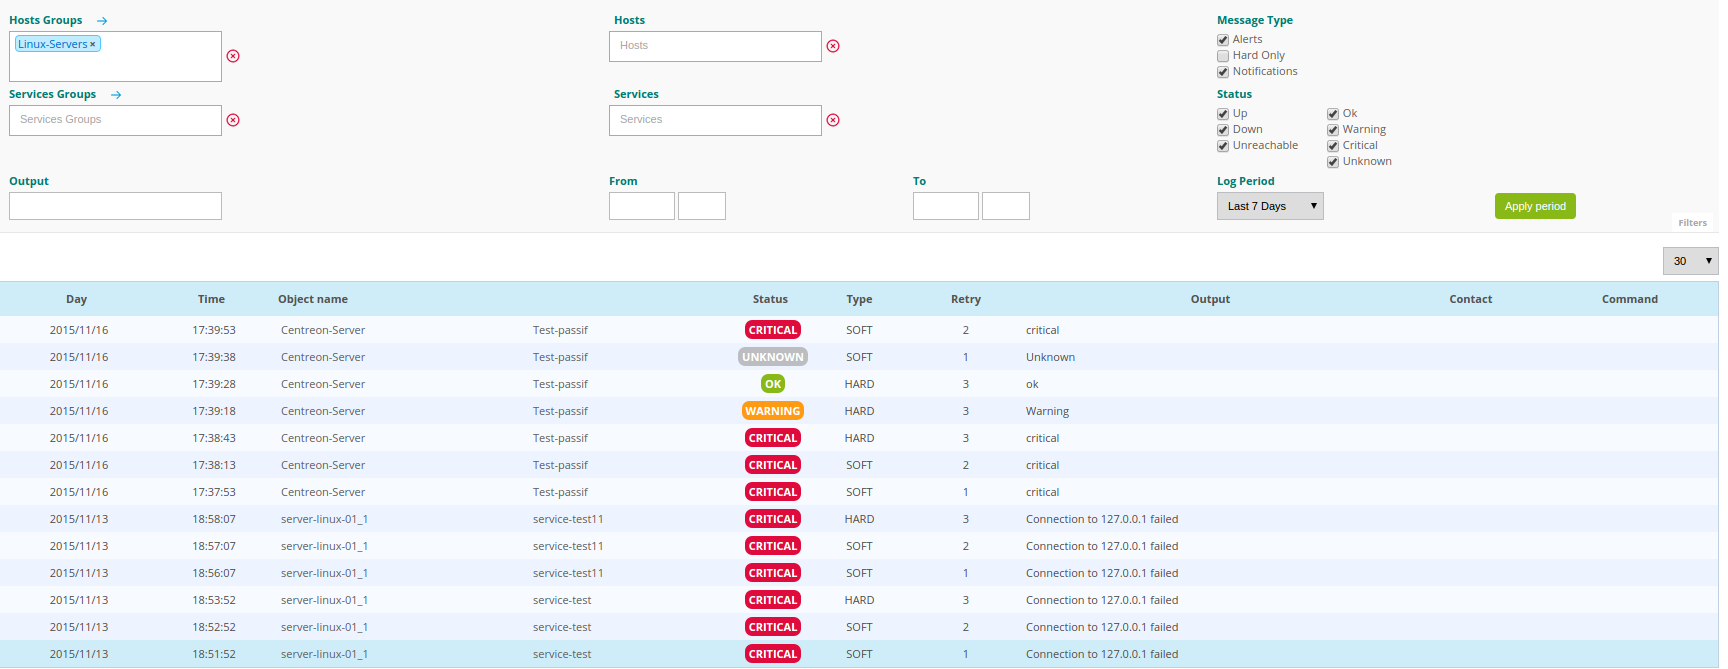
The upper menu can be used to select the hosts and/or the services event logs to be viewed. You can choose a selection of services or hosts in a list contained in servicegroup or hostgroup.
The Message Type and status field can be used to select the search filters to display the events required.
The Log Period field can be used to select the time period for which we want to view the events. The drop-down list can be used to select generic time periods. If the drop-down list is empty it is possible to choose the time period manually using the From and To fields.
The table can be used to view the results.
Filtering the logs
Type of logs
It is possible to display several types of log on the given period:
Services with the WARNING status by checking Alerts
Errors (hosts not available or services with the CRITICAL status) by checking Errors
Confirmed incidents on hosts or services (“HARD”) by clicking on Hard only
Notifications sent by clicking on Notifications
Status of the host or the service
Note
The choice made here affects the checked boxes in Message Type. It is also possible to view the different messages by selecting the status desired for the hosts or services manually.
Results
The table below describes the columns of the table of results.
Column name |
Description |
|---|---|
Day |
Show log date |
Time |
Show log time |
Object Name |
Show object name (host and/or service) |
Status |
Show object status |
Type |
Show object state (‘SOFT’ or ‘HARD’) |
Retry |
Show number of try since actual status |
Output |
Show output for the host or the service |
Contact |
Show contact (only for notification) |
Command |
Show the notification command (only for notification) |