Monitor a Cisco Router with SNMP
Go to the Configuration > Plugin Packs menu and install Cisco Standard Plugin Pack:
Go to the Configuration > Hosts > Hosts menu and click on Add:
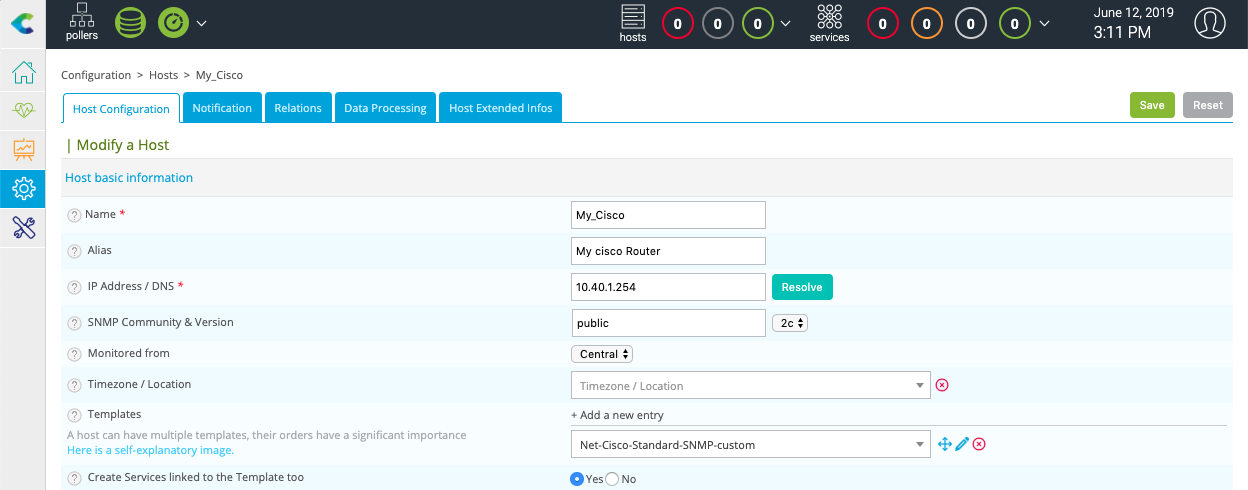
Fill in the following information:
The name of the server
A description of the server
The IP address
The SNMP version and community
Click on + Add a new entry button in Templates field, then select the Net-Cisco-Standard-SNMP-custom template in the list.
Click on Save.
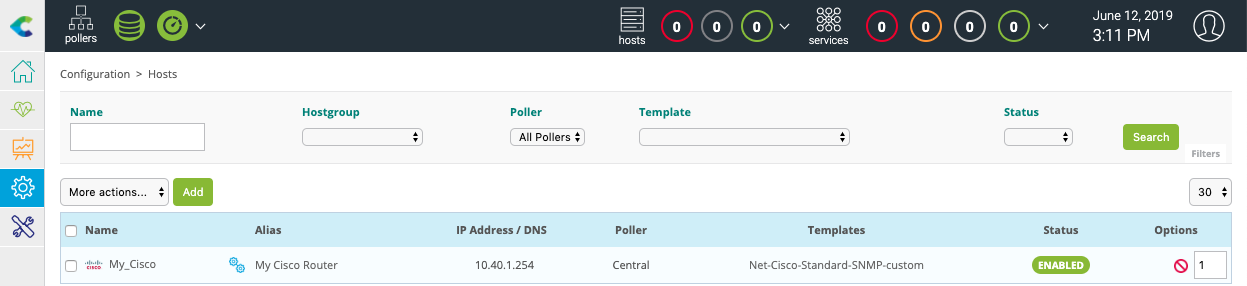
Your equipment has been added to the monitoring configuration:
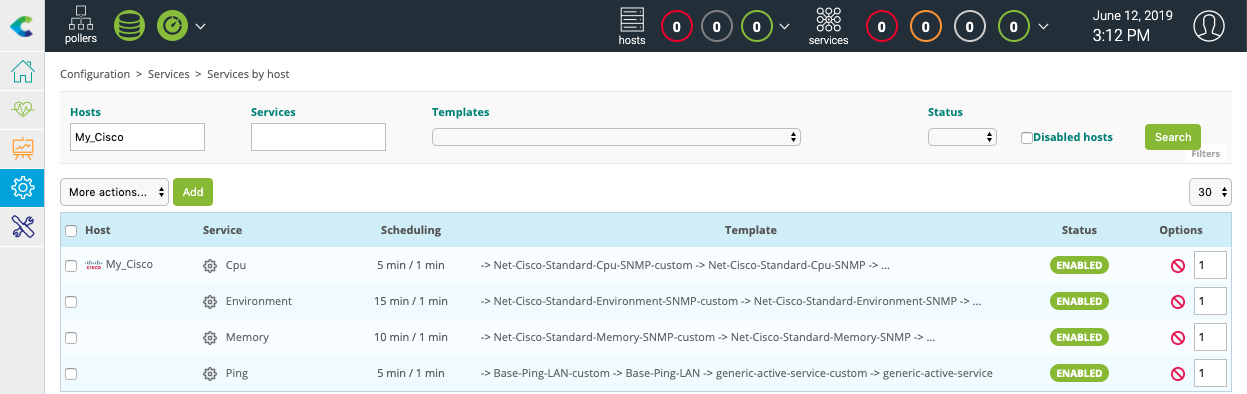
Go to Configuration > Services > Services by host menu. A set of indicators has been automatically deployed:
Other indicators can be monitored. Click on Add button to add a new service as bandwidth usage for example:
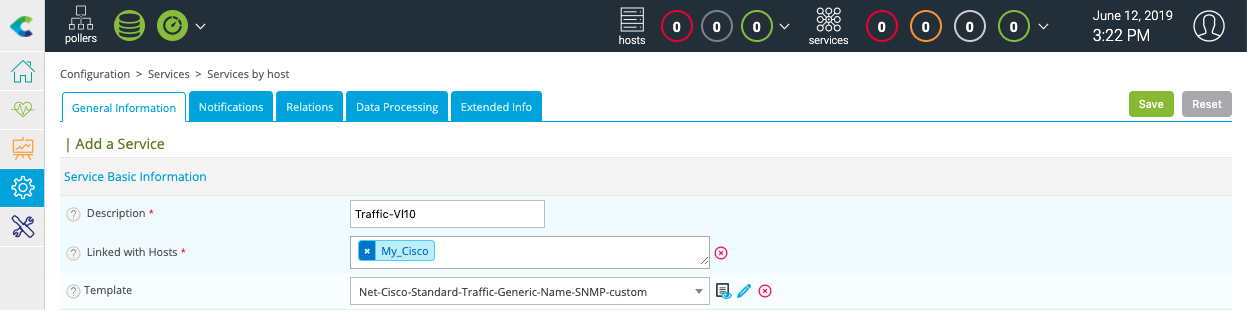
In the Description field, enter the name of the service to create, then select the host to link this service. In the Template filed, select the OS-Linux-Traffic-Generic-Name-SNMP-custom template.
A list of macros corresponding to the model will then appear:
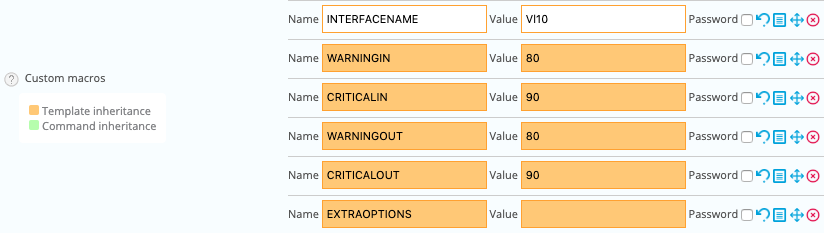
Enter the name of the network interface for the INTERFACENAME macro value and click on Save to add this indicator into the monitoring configuration.
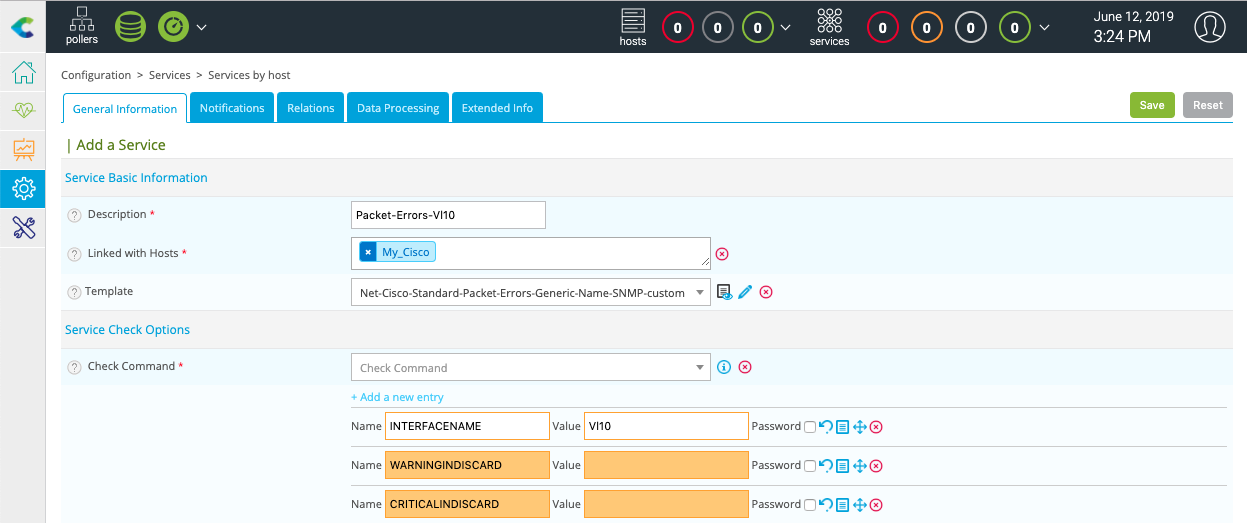
Do the same to add packet error monitoring:
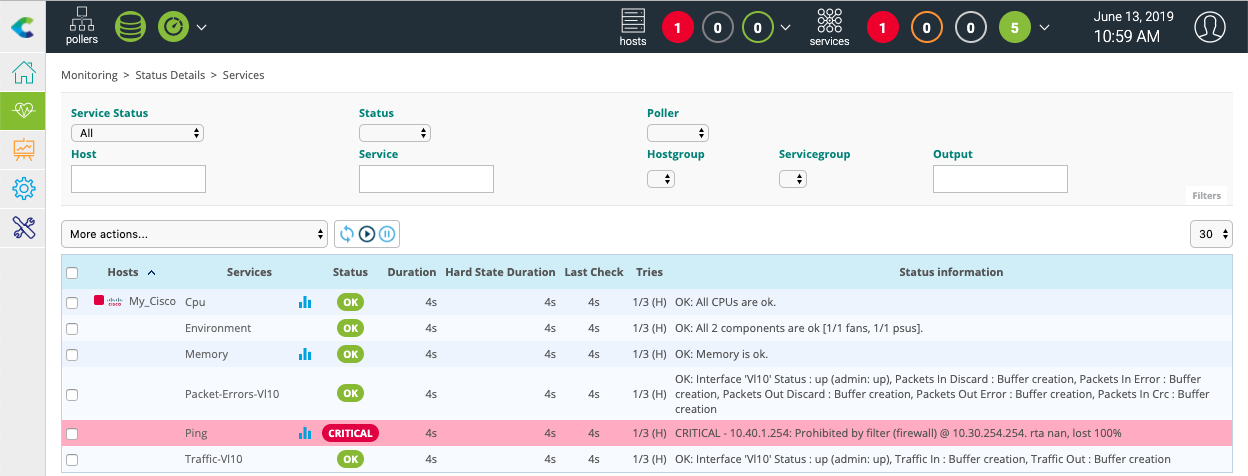
It is now time to deploy the supervision through the dedicated menu.
Then go to the Monitoring > Status Details > Services menu and select All value for the Service Status filter. After a few minutes, the first results of the monitoring appear:
To go further
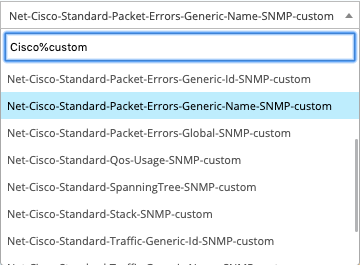
The Cisco Standard Plugin Pack provides several monitoring templates. When creating a service, it is possible to search the available models in the selection list:
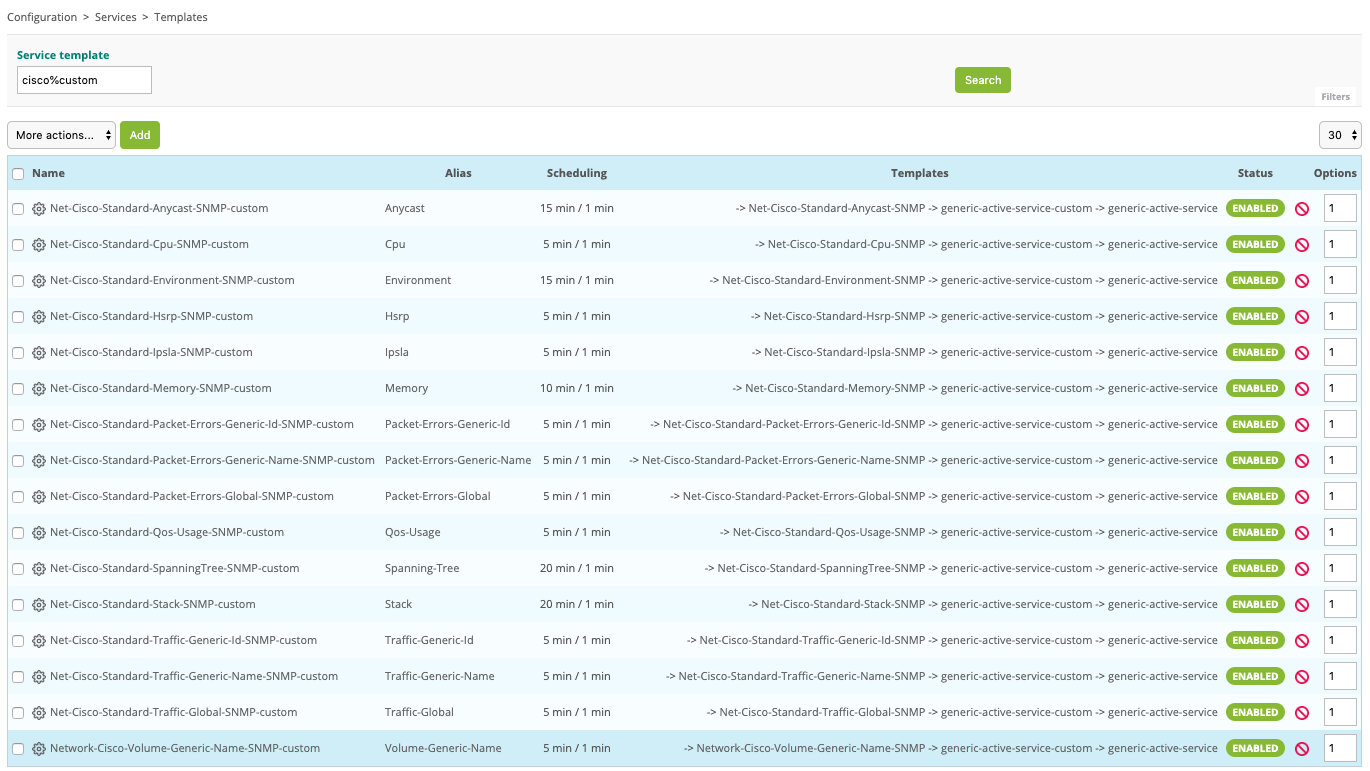
It is also possible to access the Configuration > Services > Templates menu to know the complete list:
To know the name of the available network interfaces you can execute the plugin in command line:
$ /usr/lib/centreon/plugins/centreon_cisco_standard_snmp.pl --plugin=network::cisco::standard::snmp::plugin --hostname=10.40.1.254 --snmp-community=mrthsrnrd --snmp-version=2c --mode=list-interfaces
List interfaces:
'Gi1/0/1' [speed = 1000, status = up, id = 10101]
'Gi1/0/2' [speed = 1000, status = up, id = 10102]
'Gi1/0/3' [speed = 10, status = down, id = 10103]
'Gi1/0/4' [speed = 10, status = down, id = 10104]
'Gi1/0/5' [speed = 10, status = down, id = 10105]
'Gi1/0/6' [speed = 1000, status = up, id = 10106]
'Gi1/0/7' [speed = 10, status = down, id = 10107]
'Gi1/0/8' [speed = 10, status = down, id = 10108]
'Gi1/0/9' [speed = 10, status = down, id = 10109]
'Gi1/0/10' [speed = 10, status = down, id = 10110]
'Gi1/0/11' [speed = 10, status = down, id = 10111]
'Gi1/0/12' [speed = 10, status = down, id = 10112]
'Gi1/0/13' [speed = 10, status = down, id = 10113]
'Gi1/0/14' [speed = 10, status = down, id = 10114]
'Gi1/0/15' [speed = 10, status = down, id = 10115]
'Gi1/0/16' [speed = 10, status = down, id = 10116]
'Gi1/0/17' [speed = 1000, status = up, id = 10117]
'Gi1/0/18' [speed = 10, status = down, id = 10118]
'Gi1/0/19' [speed = 10, status = down, id = 10119]
'Gi1/0/20' [speed = 100, status = up, id = 10120]
'Gi1/0/21' [speed = 10, status = down, id = 10121]
'Gi1/0/22' [speed = 1000, status = up, id = 10122]
'Gi1/0/23' [speed = 10, status = down, id = 10123]
'Gi1/0/24' [speed = 1000, status = up, id = 10124]
'Gi1/0/25' [speed = 10, status = down, id = 10125]
'Gi1/0/26' [speed = 10, status = down, id = 10126]
'Gi1/0/27' [speed = 10, status = down, id = 10127]
'Gi1/0/28' [speed = 10, status = down, id = 10128]
It is the same to know the name of the spanning-tree:
$ /usr/lib/centreon/plugins/centreon_cisco_standard_snmp.pl --plugin=network::cisco::standard::snmp::plugin --hostname=10.40.1.254 --snmp-community=mrthsrnrd --snmp-version=2c --mode=list-spanning-trees
List ports with Spanning Tree Protocol:
[port = GigabitEthernet1/0/20] [state = forwarding] [op_status = up] [admin_status = up] [index = 10120]
[port = Port-channel1] [state = forwarding] [op_status = up] [admin_status = up] [index = 5001]