Monitor a MySQL or MariaDB database
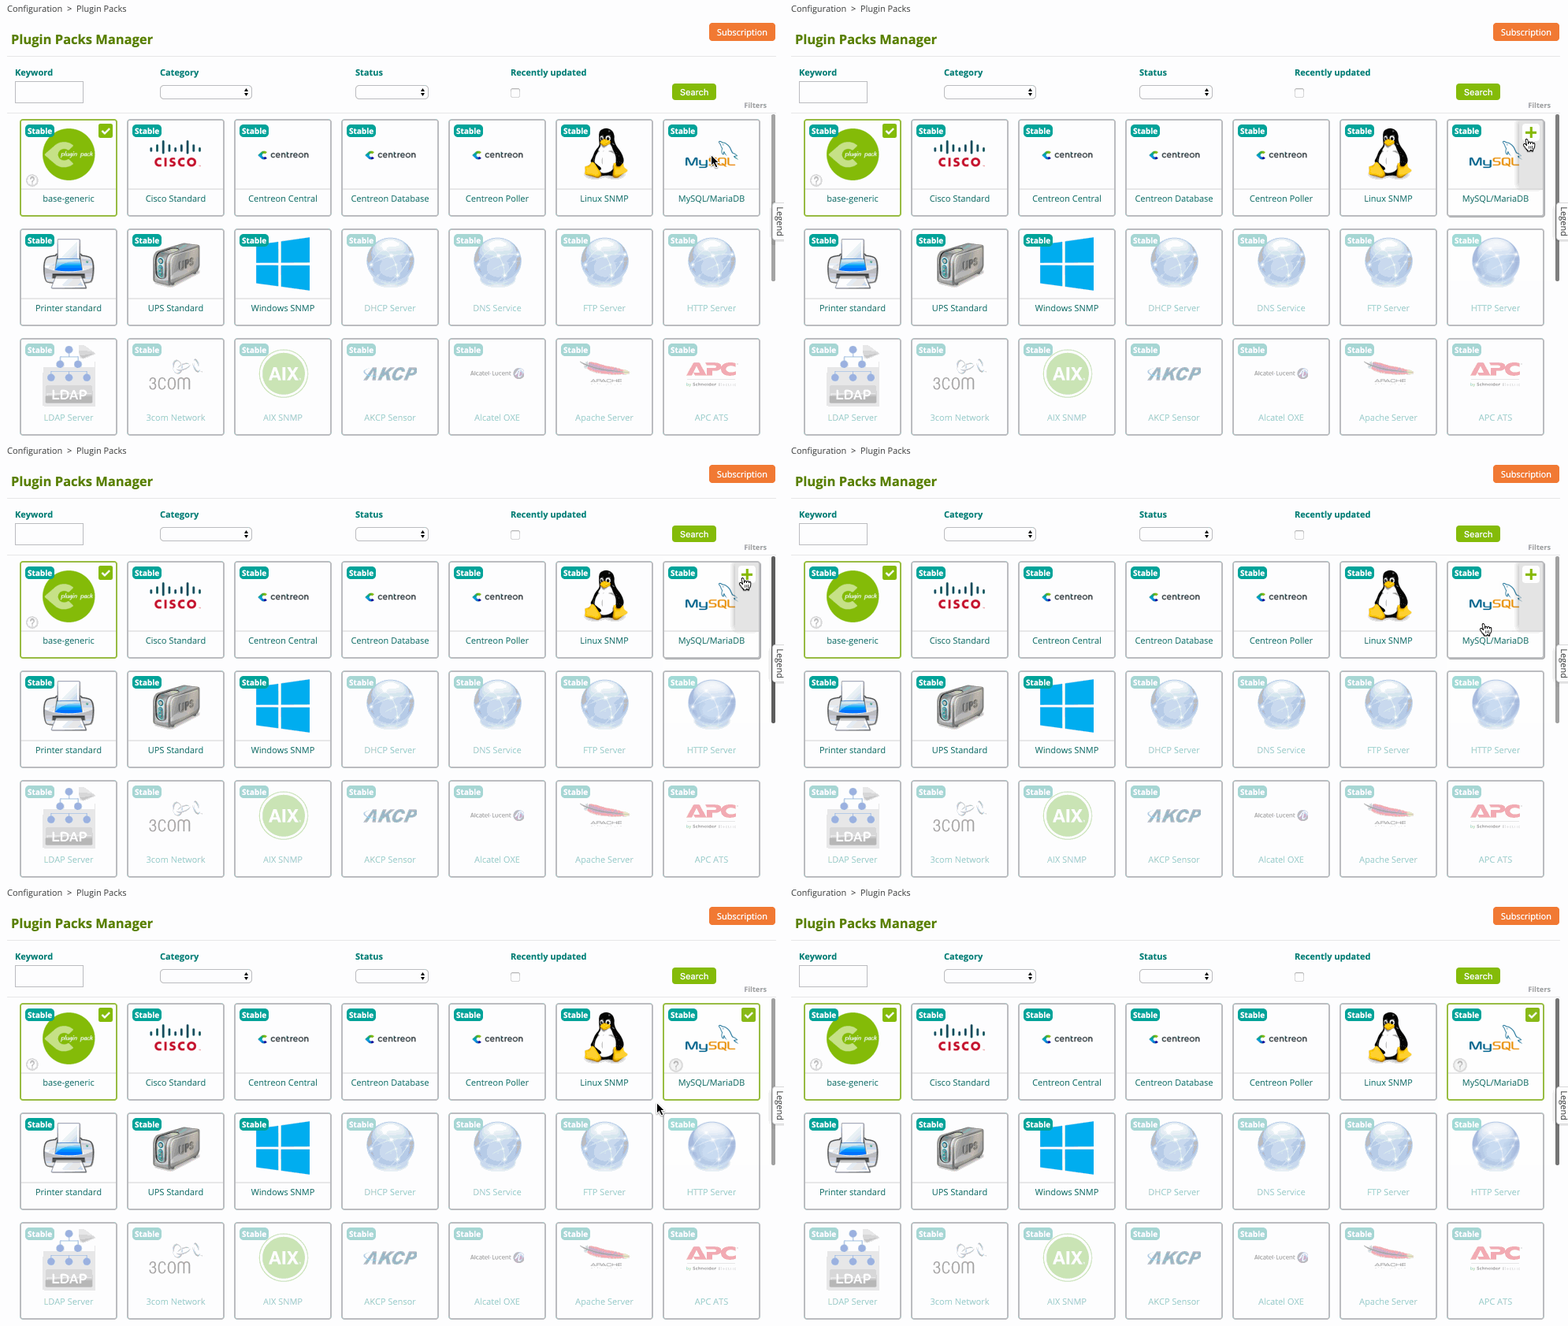
Go to the Configuration > Plugin Packs menu and install MySQL/MariaDB Plugin Pack:
Go to the Configuration > Hosts > Hosts menu and click on Add:

Fill in the following information:
The name of the server
A description of the server
The IP address
Click on + Add a new entry button in Templates field, then select the App-DB-MySQL-custom template in the list.
A list of macros corresponding to the model will then appear:

Fill in the value of following macros:
MYSQLUSERNAME: the username to connect to the database.
MYSQLPASSWORD: the password of the user.
MYSQLPORT: the TCP port to connect to the database, by default 3306.
Click on Save.
Your equipment has been added to the monitoring configuration:

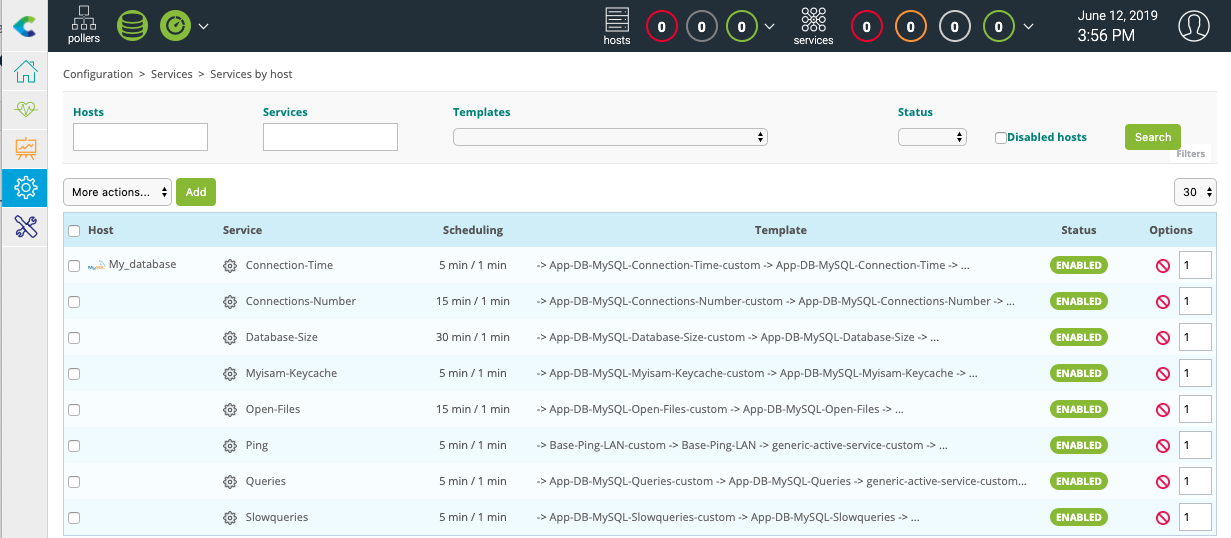
Go to Configuration > Services > Services by host menu. A set of indicators has been automatically deployed:
It is now time to deploy the supervision through the dedicated menu.
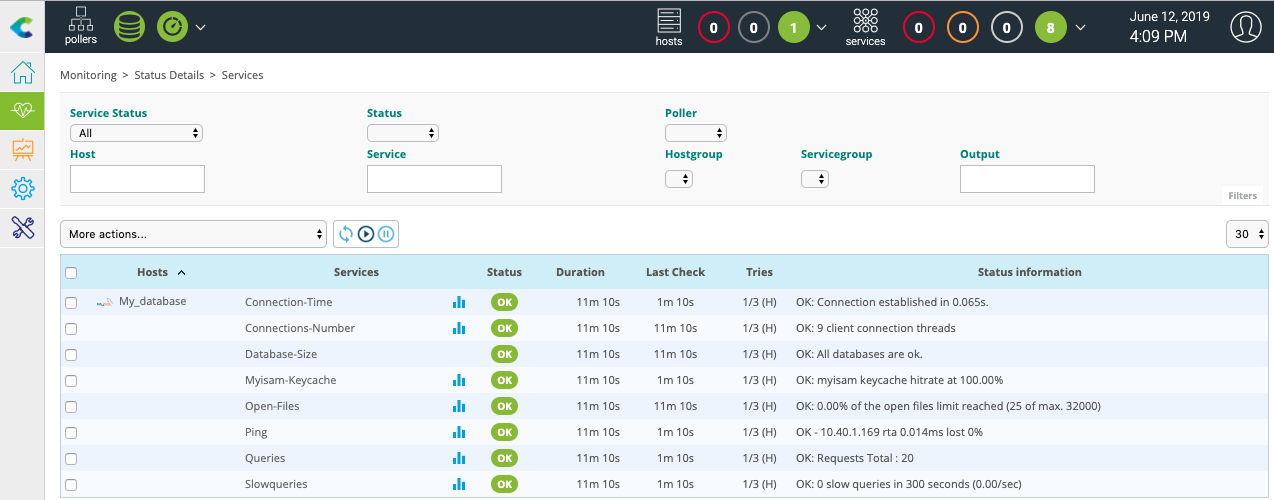
Then go to the Monitoring > Status Details > Services menu and select All value for the Service Status filter. After a few minutes, the first results of the monitoring appear:
To go further
The MySQL/MariaDB Plugin Pack provides several monitoring templates. When creating a service, it is possible to search the available models in the selection list:
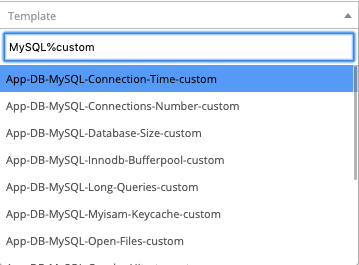
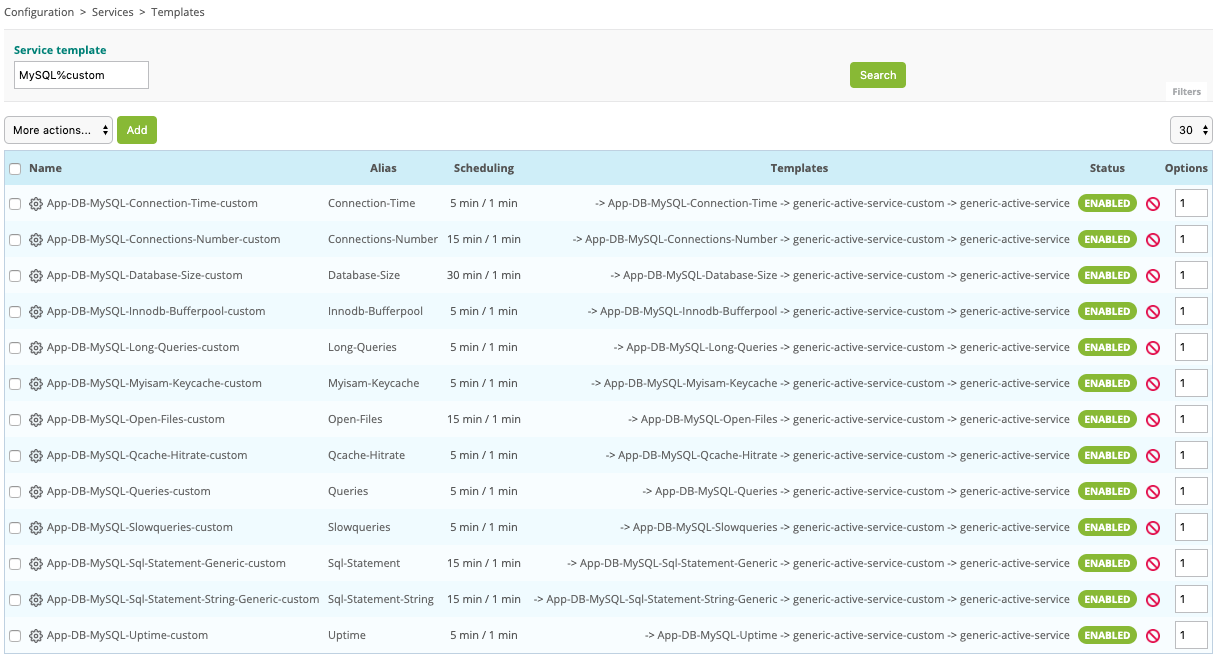
It is also possible to access the Configuration > Services > Templates menu to know the complete list:
